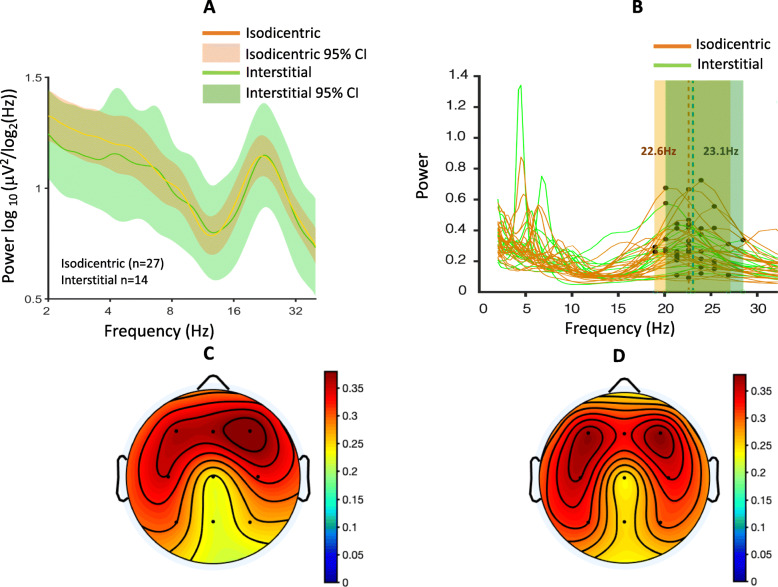
Fig. 3.
Duplication type and beta power/beta peak frequency. a Spectral profiles of isodicentric (orange) and interstitial (green) duplication groups. PSDs are averaged across channels, log10 transformed, and then averaged across participants; colored highlights represent 95% confidence intervals. b PSDs derived from isodicentric (orange) and interstitial (green) duplication groups. Beta peaks from each individual are labeled in black (group-level averages: isodicentric, f = 22.6 Hz; interstitial, f = 23.1 Hz.). c Mean topographic scalp power (mean across participants at the group-level peak frequency, f = 22.8 Hz) for participants with interstitial duplications. d Mean topographic scalp power (mean across participants at the group-level peak frequency, f = 22.8 Hz) for participants with isodicentric duplications

