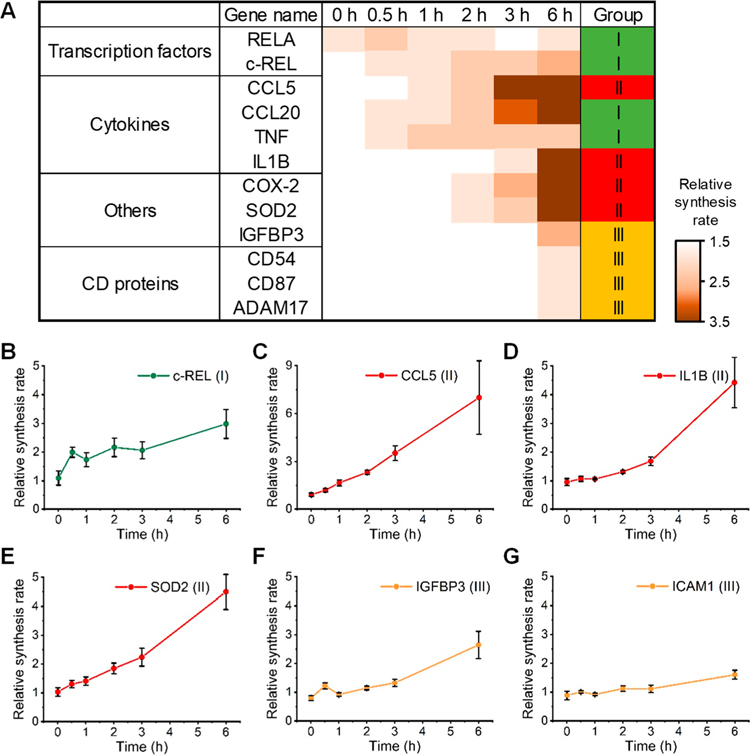
Figure 5.
Relative synthesis rates of transcription factors, cytokines, and other proteins in macrophages treated with LPS. (A) Heat map showing the relative synthesis rates of several example proteins at each time point during the LPS treatment. (B–G) The relative synthesis rates with the error bars referring to the standard deviation at each time point for (B) c-REL, (C) CCL5, (D) IL1B, (E) SOD2, (F) IGFBP3, and (G) ICAM1 (CD54).

