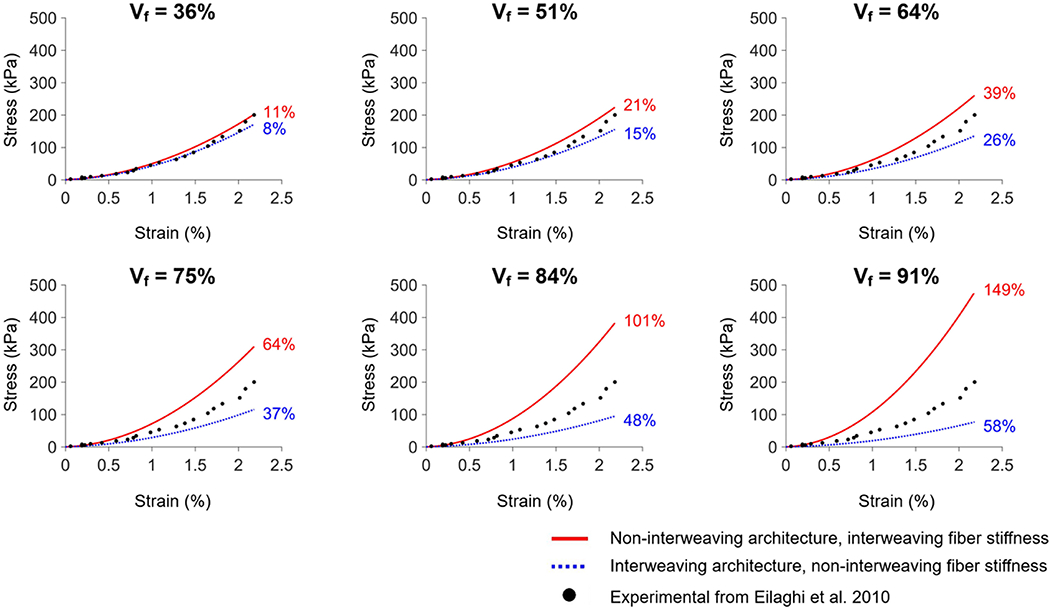
Figure 6.

Evaluating the impact of the differences in parameters, akin to that of Figure 5, but for various collagen volume fractions. Non-interweaving model simulated with parameters from interweaving model and vice versa. The numbers next to the curves indicate the % deviation relative to the experimental data (see Methods section for the definition). Removing the interweaving of the interwoven model, or adding interweaving to the non-interwoven model results in changes in the stiffness curves. The effects were minimal for low volume fractions, but increased substantially at large volume fractions. Readers may find it useful to refer to Figure 2 for the model geometries. Vf: collagen volume fraction.
