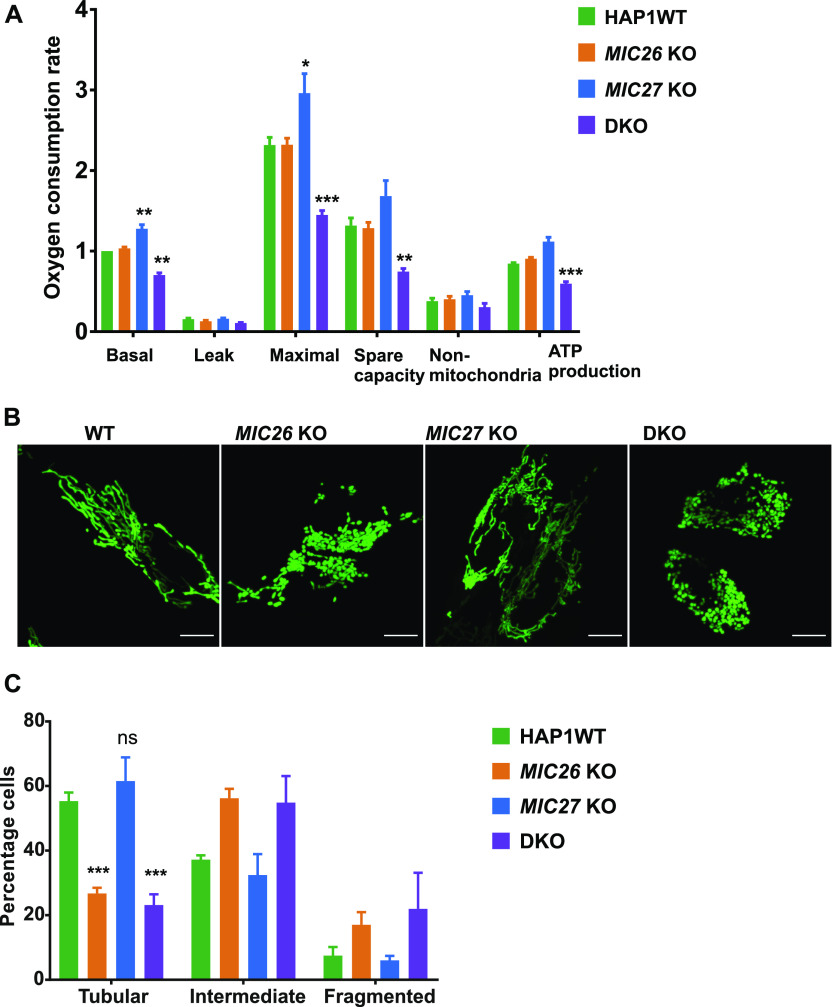
Figure 2. Mitochondrial respiration is impaired and mitochondria show fragmentation in double knockout (DKO) cells lacking MIC26 and MIC27.
(A) Oxygen consumption rates (pmol O2/s, normalized for cell numbers by Hoechst staining), including basal respiration (Basal), proton leak, maximal respiration (Maximal) after uncoupling by FCCP, spare respiratory capacity (Spare capacity), non-mitochondrial respiration (Non-mitochondrial), and ATP production is shown for HAP1 WT, MIC26 KO, MIC27 KO, or DKO cells. Data are normalized to basal respiration from HAP1 WT and the mean ± SEM from four independent experiments is shown. DKO cells lacking MIC26 and MIC27 show reduced respiration, whereas MIC27 KO show slight but significant increase compared with HAP1 WT. *P-value ≤ 0.05, **P-value ≤ 0.01, ***P-value ≤ 0.001 (t test). For comparison of basal respiration, one sample t test was performed. (B) Representative confocal images of mitochondria from HAP1 WT, MIC26 KO, MIC27 KO, or DKO cells show mitochondrial fragmentation in MIC26 KO and DKO cells. (C) Quantification of percentage of cells having tubular, intermediate, or fragmented mitochondrial morphology in HAP1 WT, MIC26 KO, MIC27 KO, or DKO cells. Data show mean ± SEM from three independent experiments. t test was used for comparison of percentage of cells having tubular mitochondria in MIC26 KO, MIC27 KO, or DKO cells with HAP1 WT. ***P-value ≤ 0.001.

