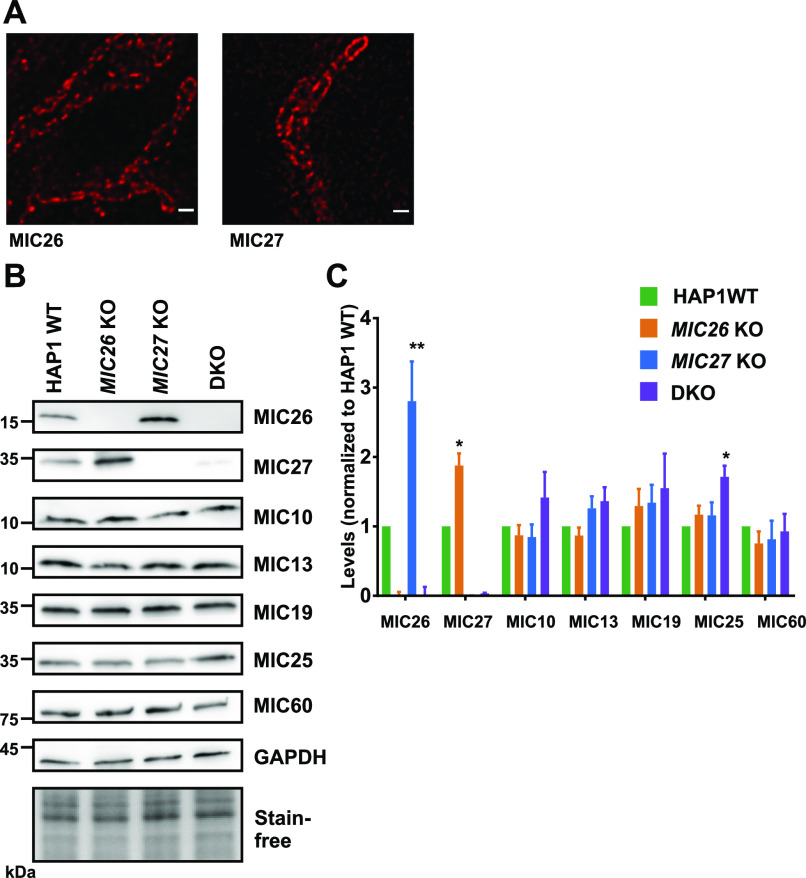
Figure 3. MIC26 and MIC27 are not required for the stability of other MICOS subunits.
(A) Representative STED super-resolution images of MIC26 or MIC27 in control cells show the punctae rail-like arrangement within mitochondria that resemble the staining from MIC60 or MIC10 (see also Fig 4A). Scale bar 0.5 μm. (B) Western blots of total cell lysates from HAP1 WT, MIC26 KO, MIC27 KO, or double knockout (DKO) cells probed for various subunits of the MICOS complex. (C) Densitometric quantification of Western blots from four independent experiments (mean ± SEM) in HAP1 WT, MIC26 KO, MIC27 KO, or DKO cells that are normalized to levels of each MICOS subunits to the HAP1 WT. Except MIC26 or MIC27 levels (showing reciprocal change), steady-state levels of other MICOS subunits were not drastically reduced in single knockouts or DKO cells of MIC26 and MIC27. One sample t test was used for comparison. Marginal increase in MIC25 was found in DKO cells. *P-value ≤ 0.05. **P-value ≤ 0.01.

