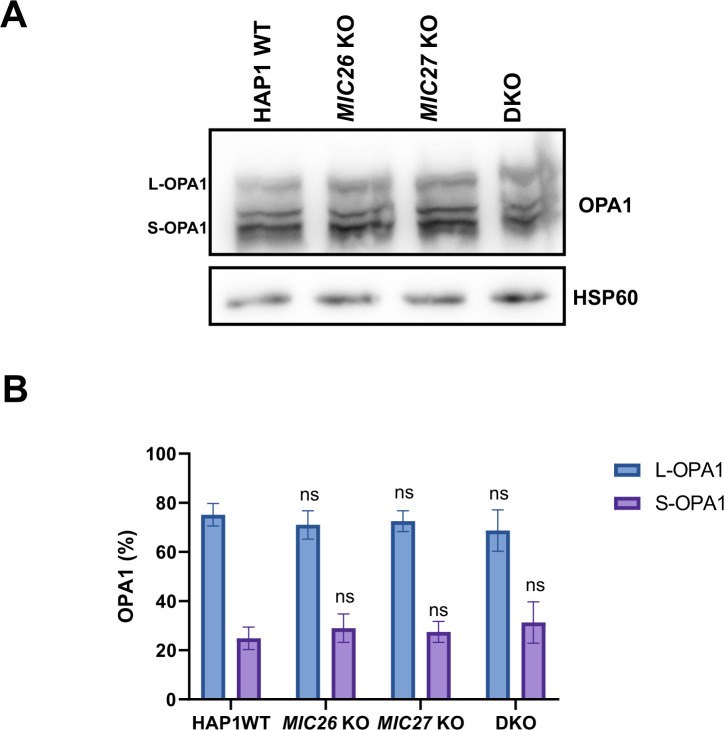
Figure S6. OPA1 forms are unaltered in double knockout cells lacking MIC26 and MIC27.
(A) Western blot showing the distribution and levels of OPA1 forms long or short in HAP1 WT, MIC26 KO, MIC27 KO, or double knockout cells show no change in distribution of OPA1 forms. (B) Bar graph represent percentage of OPA1 in either L-OPA1 (long form) or S-OPA1 (Short form) in respective cell lines from six independent experiments. ns = P-value > 0.05 (non-significant). t test was used for all comparisons.

