Figure 2.
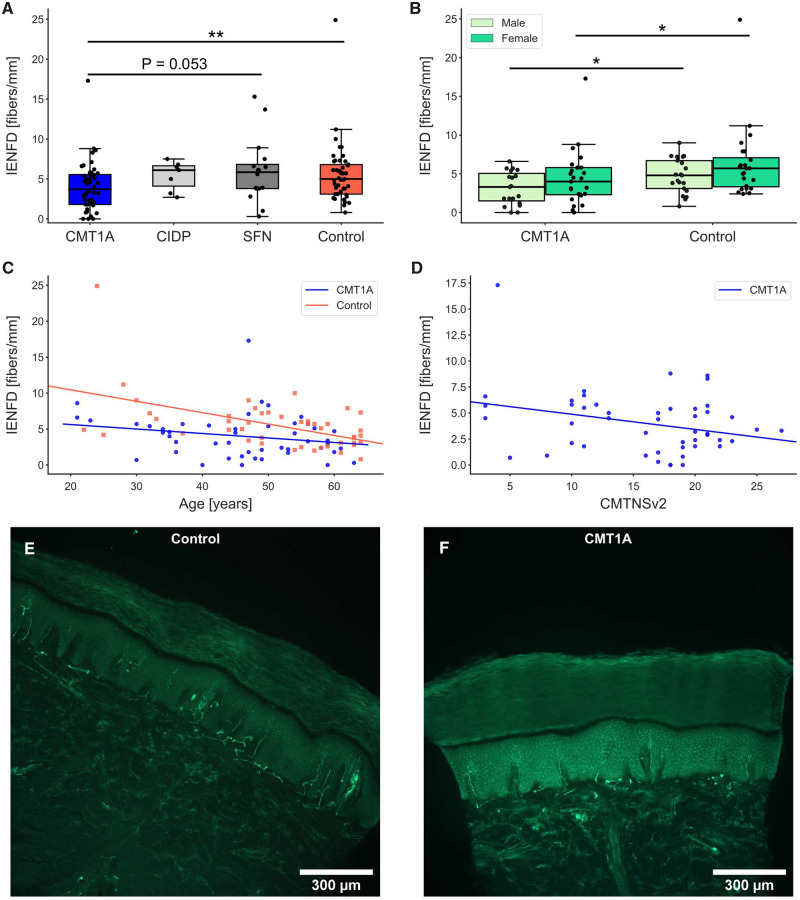
IENFD in patients with CMT1A compared with CIDP, SFN and healthy controls. (A) There was a significant reduction in IENFD in CMT1A compared with the healthy control group; **P < 0.01. (B) In CMT1A and controls, IENFD of females showed a trend to be higher compared with the IENFD of men of the same group (n.s.). Significant differences were still present between CMT1A and controls when divided into males and females; *P < 0.05. (C) In controls, IENFD showed an inverse correlation with age (P < 0.001, R = −0.51), but not in patients with CMT1A (P = 0.1, R = −0.22). (D) In CMT1A, IENFD correlated negatively with the CMTNSv2 (P < 0.05, R = −0.29). Representative micrographs of skin sections labelled with anti-PGP9.5 from a control (E) and a patient with CMT1A (F). The control section shows a higher IENFD than the CMT1A section.

