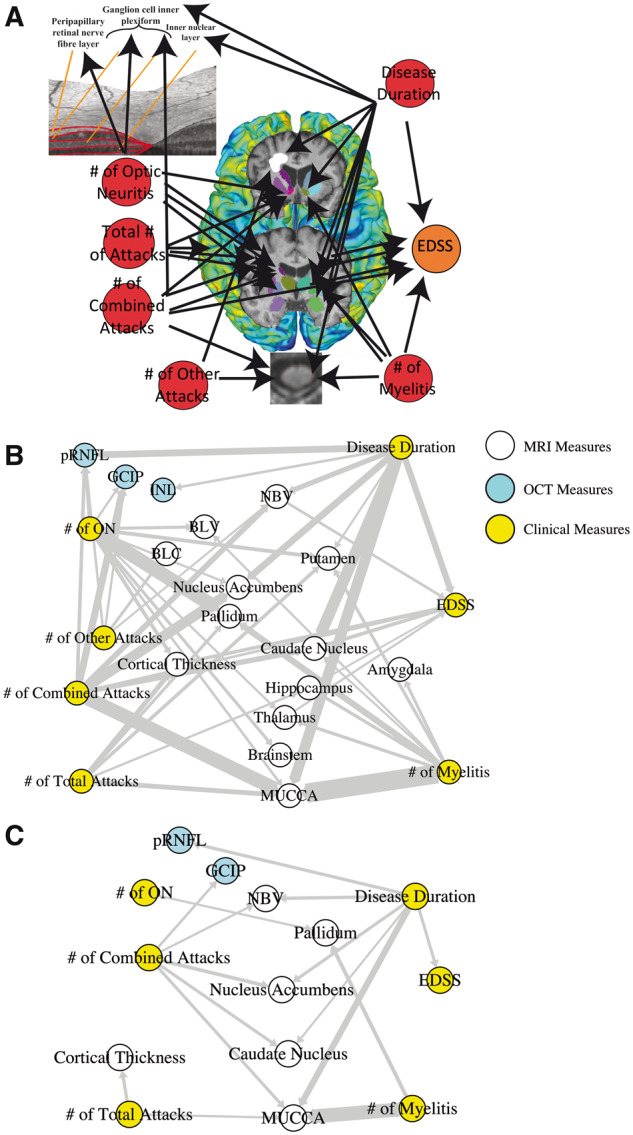
Figure 1.

Application of graph theory-based multimodal network analysis on AQP4-IgG+ NMOSD MRI, OCT and clinical data. (A) Representation of the nodes in the multimodal network analysis employed in this study, where clinical attacks and disease duration were investigated for their effects on retinal measures, cortical thickness, DGM volumes, MUCCA, brain lesions and EDSS; (B) Multimodal network analysis of 80% probability F-distribution in AQP4-IgG+ NMOSD patient MRI, OCT and clinical measures, where width of arrows indicate F-statistic value (wider = higher value); (C) Multimodal network analysis of 95% probability F-distribution in AQP4-IgG+ NMOSD patient MRI, OCT and clinical measures, where width of arrows indicate F-statistic value (wider = higher value). BLC = brain lesion count; BLV = brain lesion volume; EDSS = expanded disability status scale; GCIP = ganglion cell inner plexiform; INL = inner nuclear layer; MUCCA = mean upper cervical cord area; NBV = normalized brain volume; ON = optic neuritis; pRNFL = peripapillary retinal nerve fibre layer.
