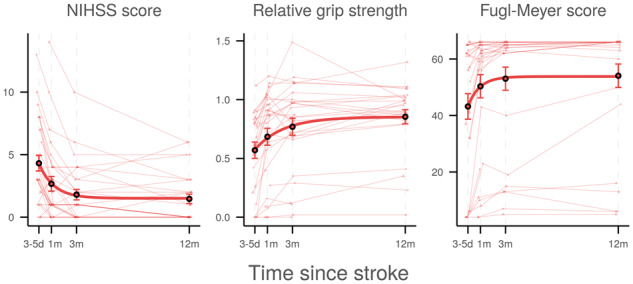
Figure 1.

Temporal profiles of clinical outcome parameters. Horizontal axes indicate time after stroke. Thin lines represent linearly interpolated profiles for individual patients. Diamonds and triangles indicate patients with left- and right-sided lesions, respectively. Circles and bars denote cross-sectional means and asymptotic standard errors, respectively. Thick lines visualize the non-linear model, . d = days; m = months; NIHSS = National Institutes of Health Stroke Scale.
