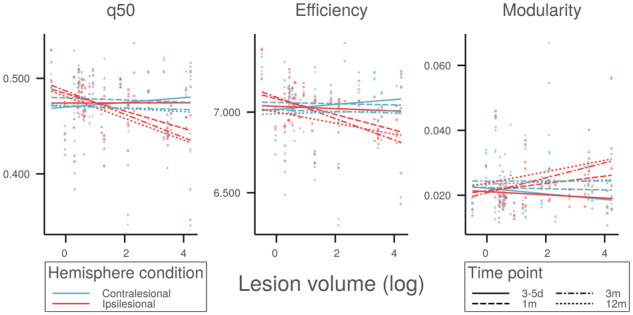
Figure 3.

Association between global topology and infarct size. Relation between global network measures of ipsilesional (red) and contralesional (blue) hemispheres, and stroke lesion volume. Line segments represent cross-sectional predicted means of network measures in the acute (3–5 days, squares, solid), subacute (1 month, circles, dashed; 3 months, triangles, dot-dashed), and chronic (12 months, diamonds, dotted) phases after stroke. q50 = median connectivity.
