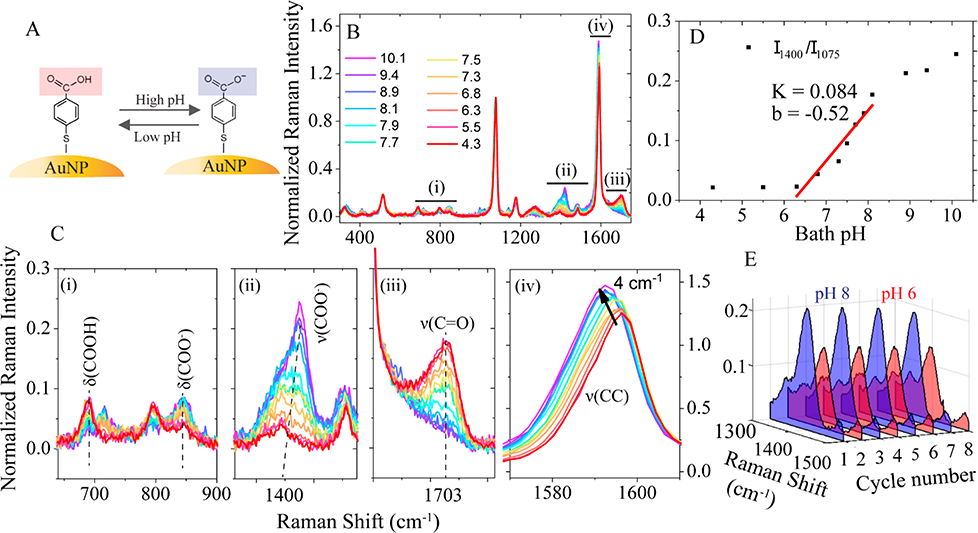
Fig. 2.
(A) The schematic of reversible changes of the carboxyl group of 4-MBA as a result of pH changes. (B) The SERS spectra of the nanopipette-based nanoprobe in bath solution with different pH values. (C) ((i)-(iv)) The zoom-in of four pH-sensitive spectral regions marked in (B). (D) pH calibration curve obtained by plotting the ratio of 1400 cm−1 against different pH values. The black dots are fitted by linear regression equation and plotted as a solid red line. (E) The 3D SERS spectra of the normalized intensity change of band 1400 cm−1 when the bath solution pH was alternated between 8.0 and 6.0 for 8 cycles.

