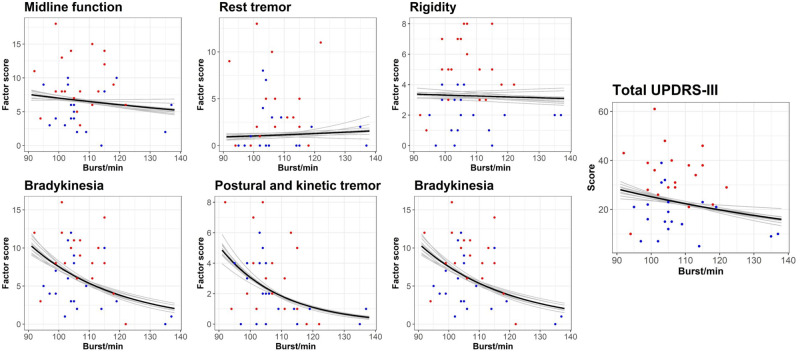
Figure 7.
Relation between the beta burst rate and MDS-UPDRS-III subscales. Coloured dots are individual measurements off medication (red) and on medication (blue). The solid line is the regression model of burst rate on the score on MDS-UPDRS-III subscales. The shaded lines are on k-fold cross-validation of the regression models. MDS-UPDRS-III = Movement Disorder Society’s Unified Parkinson’s Disease Rating Scale, part III.

