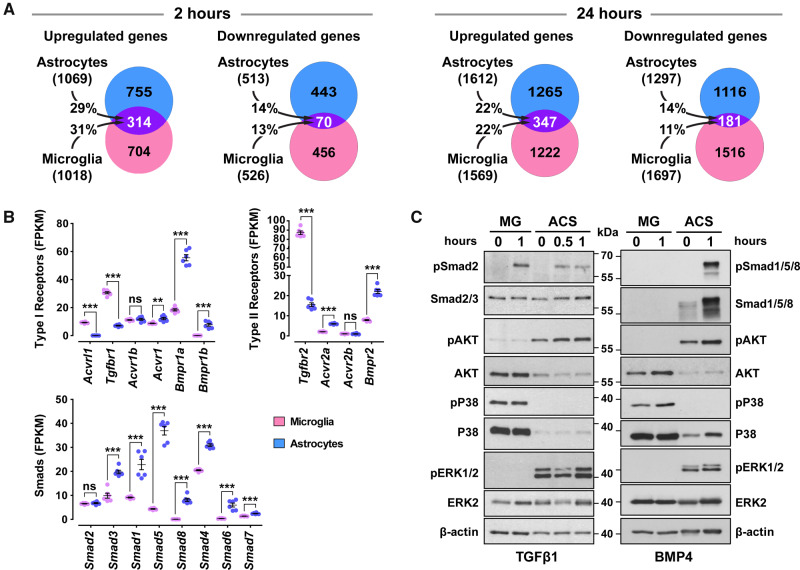
Figure 4.
Astrocytes and microglia modulate expression of distinct sets of genes upon TGFβ1 treatment, express different components of the canonical pathways and are poised to activate different non-canonical pathways. (A) Venn diagrams representing the number of statistically significant (baseMean > 30 and FDR < 0.05) up- or down-regulated genes only in astrocytes (light blue), only in microglia (pink) or in both glial populations (purple), following stimulation with 2 ng/ml TGFβ1 for 2 h (left panel) or 24 h (right panel). The percentages indicate the gene overlap between astrocytes and microglia (n = 3 cultures/group). (B) mRNA expression levels of key components of the TGFβ-superfamily system, including type-I receptors, type-II receptors and Smads, in vehicle-treated purified microglia (magenda dots) or astrocytes (blue dots) derived from RNA-Seq data that were normalized and expressed as Fragments Per Kilobase per Million reads mapped (FPKM) (n = 6 cultures/group). **P < 0.01; ***P < 0.001; two-tailed unpaired t-test. (C) Representative immunoblot analysis of canonical and non-canonical TGFβ-signalling pathways using antibodies against pSmad2, total Smad2/3, pSmad1/5/8, total Smad1/5/8, phosphorylated AKT (pAKT), total AKT, phosphorylated P38 (pP38), total P38, phosphorylated ERK1/2 (pERK1/2), total ERK2 and β-actin (loading control) in purified microglia (MG) and astrocytes (ACS) upon 10 ng/ml TGFβ1 (on the left) or 50 ng/ml BMP4 stimulation (on the right).

