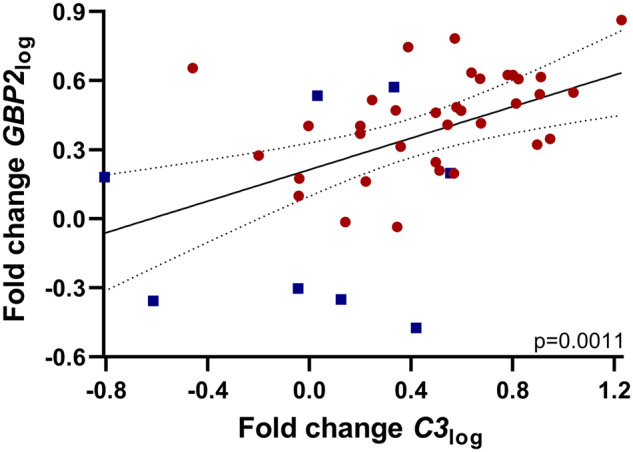
Figure 1.

Correlation analysis of two mRNA markers of A1 astrocytes, GBP2 and C3, following log-transformation. Symbols represent the following: ■, control; ●, sCJD frontal cortex brain tissues. GBP2log and C3log significantly correlate (Pearson r test, P = 0.0011). Graph shows line of best fit, and dotted lines show the 95% confidence interval (95% Confidence Interval = 0.2111–0.6827, r = 0.4810); n = 43.
