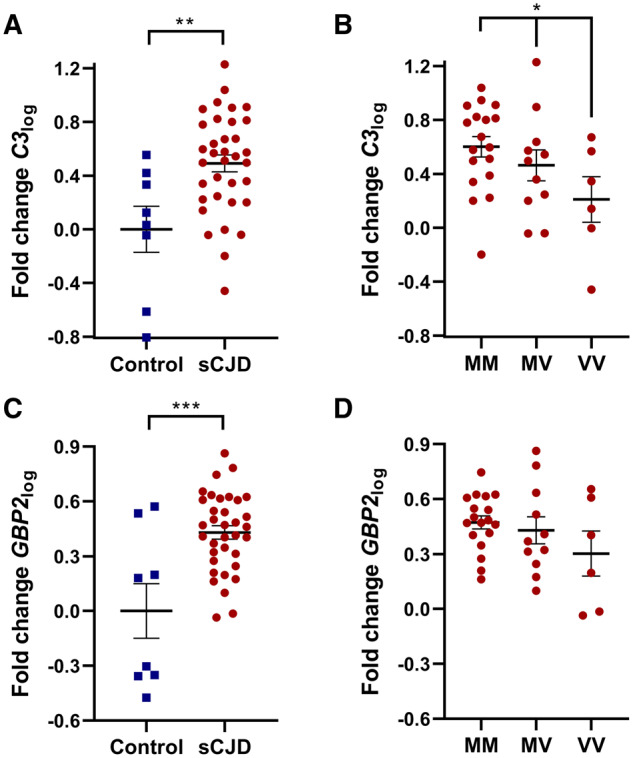
Figure 2.

Expression of reactive A1 astrocyte markers in sCJD and control frontal cortex brain tissues and stratification to codon 129 genotype in sCJD. Symbols represent the following: ■, control; ●, sCJD brain tissues. (A) C3log was significantly elevated in sCJD brain tissues compared with control samples (Student’s t-test, n = 8,35, P = 0.0029) and (B) in the sCJD tissues C3log expression stratified according to codon 129 genotype (one-way ANOVA with a multiple comparisons test for linear trend, n = 18,11,6, P = 0.027). (C) GBP2log was significantly elevated in sCJD brain tissues compared with control samples (Student’s t-test, n = 8,35, P = 0.0002). (D) Stratifying GBP2log expression to codon 129 genotype was not statistically significant (one-way ANOVA with a multiple comparisons test for linear trend, n = 18,11,6).
