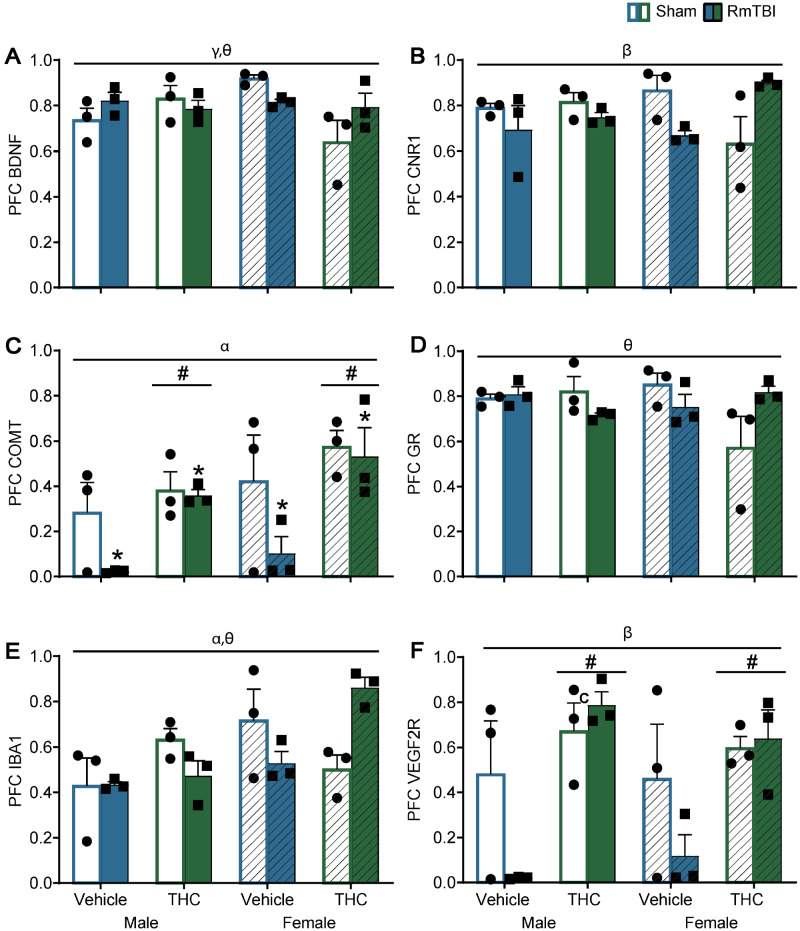
Figure 4.
Graphical depictions of the RT-qPCR results in the PFC as mean ± SEM for the post-injury THC administration groups. White and white hashed bars display sham groups (males and females, respectively), while blue and green bars display RmTBI groups. Statistical significance symbols are displayed above the bars (α) indicates a main effect for sex, (*) indicates a main effect for RmTBI, (#) indicates a main effect for THC, (β) indicates a RmTBI by THC interaction, (γ) indicates a sex by THC interaction and (θ) indicates a sex by RmTBI by THC three-way interaction.

