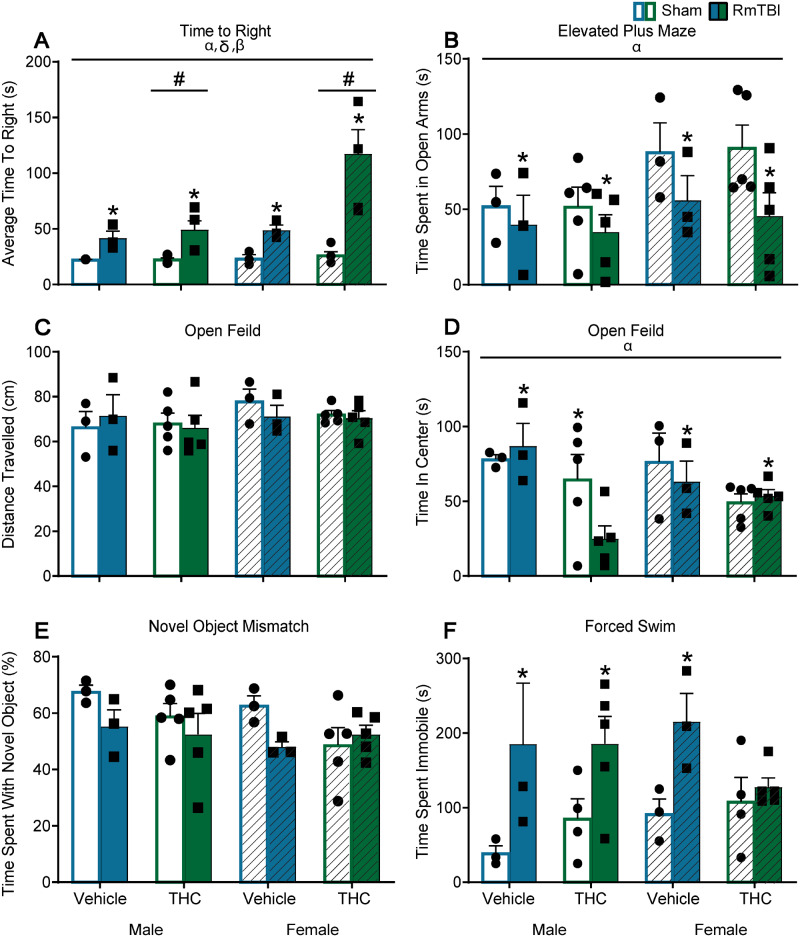
Figure 7.
Graphical depictions of the behavioural testing results displayed as mean ± SEM for the pre-injury THC administration groups. White and white hashed bars display sham groups (males and females, respectively), while blue and green bars display RmTBI groups. Statistical significance symbols are displayed above the bars (α) indicates a main effect for sex, (*) indicates a main effect for RmTBI, (#) indicates a main effect for THC, (β) indicates a RmTBI by THC interaction and (δ) indicates a sex by RmTBI interaction. (A) The mean time to right following injury or sham procedures. (B) The mean time spent in the open arm of the EPM. (C and D) The mean distance travelled and time spent in the centre of the open field, respectively. (E) The percentage of time spent investigating the novel object in the novel context mismatch. (F) The mean time spent immobile during the forced swim test.

