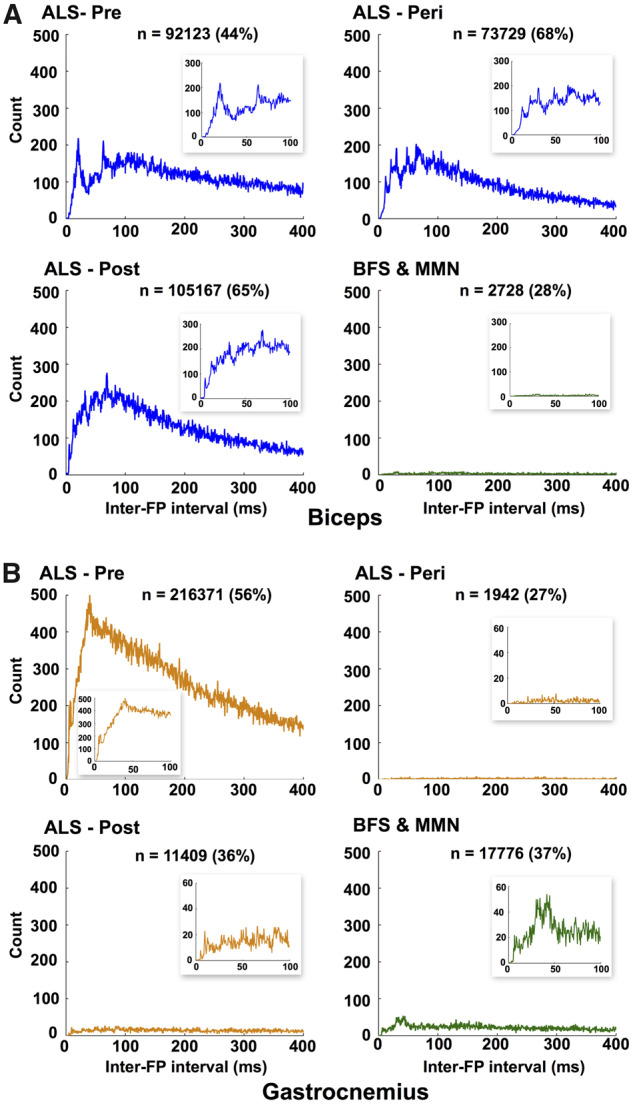
Figure 4.

Analysis of IFIs. Histogram of intervals between successive FPs in the ‘super-channel’ (see ‘Materials and methods’ section for explanation) for (A) biceps and (B) gastrocnemius. These represent intervals between FPs arising from different MUs. FPs have been recorded from bilateral muscles of 26 patients with amyotrophic lateral sclerosis (1–7 assessments per patient), 6 patients with benign fasciculation syndrome (2–7 assessments per patient) and 1 patient with multifocal motor neuropathy (6 assessments). Bin width = 0.5 ms. x-Axis cut-off at 400 ms. n = number of IFIs detected in range 0–400 ms (percentage of total number within each group given in brackets). Insets show zoomed results between 0 and 100 ms. Note varying y-axis scales of insets. FP: fasciculation potential.
