Fig. 2.
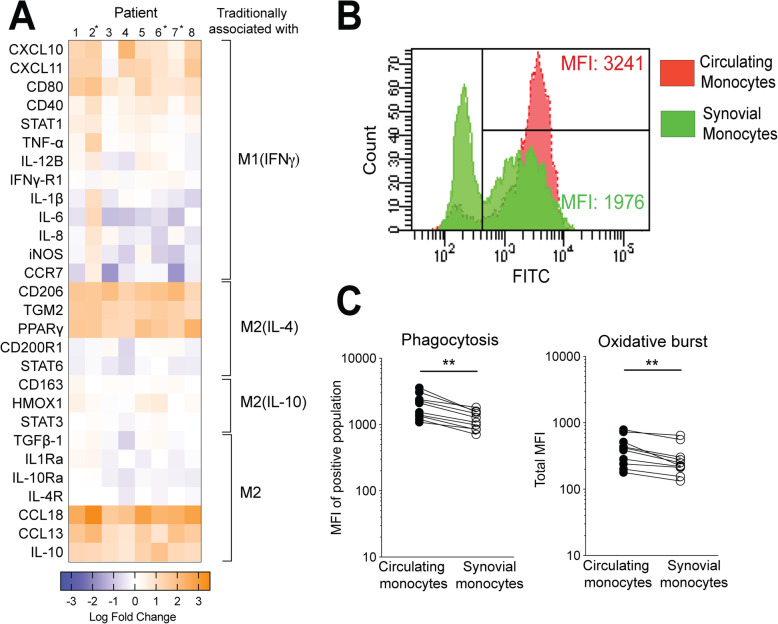
Synovial monocytes display a complex M1–M2-mRNA pattern and have an impaired phagocytosis. a Heatmap based on qPCR analysis of the fold change between synovial and circulating monocytes using 28 polarization-related markers at the surface to transcription level. Data was normalized using the ΔΔCt method to the geometric mean of the house-keeping genes PPIA, ACTB, and B2M. Log base 10. Paired n = 5, *patients analyzed without paired mRNA from circulating monocytes, n = 3. Unpaired data was analyzed based on the geometric mean of the patients with paired circulating monocytes. b Representative gating plot of the phagocytosis analysis were monocytes phagocytosed FITC labeled opsonized E. coli. The MFI of the positive population was used for further analysis. c Synovial monocytes display an impaired phagocytosis compared to circulating monocytes: 1082 (846–1702) vs 1462 (1237–2353), **p < 0.01, n = 9. Oxidative burst performance by synovial monocytes is affected using PMA as stimuli 234 (170–298) vs 337 (211–432), **p < 0.01, n = 9. Statistics was performed using Wilcoxon matched-pairs signed rank test. Data are shown as median. MFI-median fluorescence intensity

