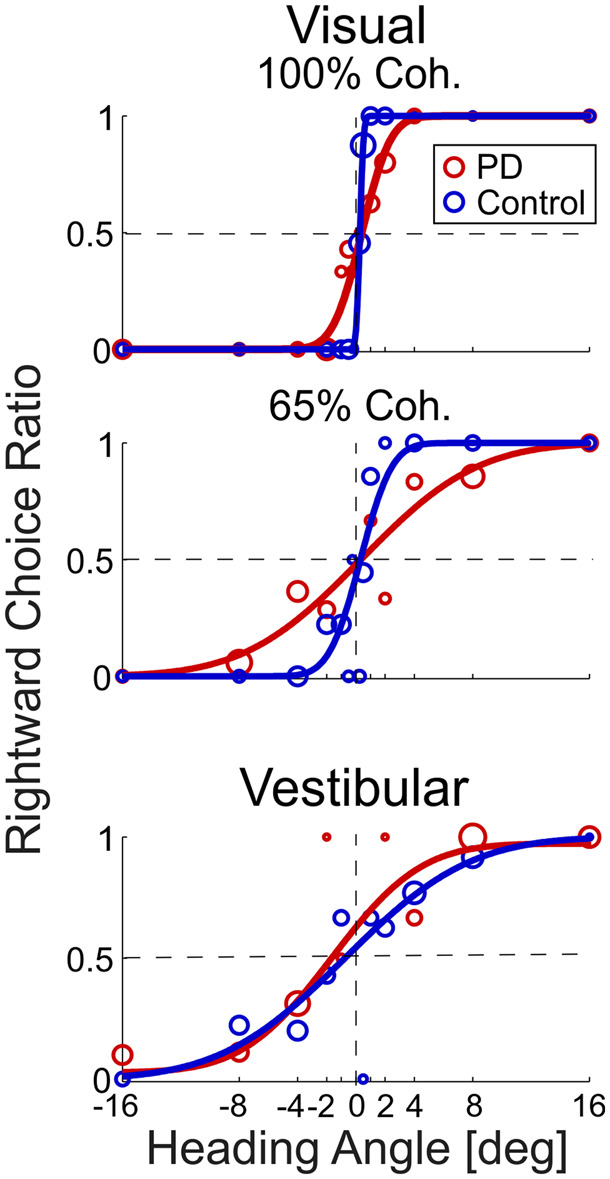
Figure 2.

Example psychometric plots.
Behavioural responses to visual stimuli at 100% coherence (top plot), 65% coherence (middle plot) and vestibular stimuli (bottom plot) are presented for an example Parkinson’s disease participant (PD, red) and an example age-matched control participant (dark blue). Circle markers represent the ratio of rightward choices for a specific heading (marker size reflects the number of trials collected at that heading). The data were fitted with cumulative Gaussian distribution functions (solid lines). The vertical dashed line marks heading = 0°, and the horizontal dashed line marks y = 0.5 (equal probability of rightward and leftward choices).
