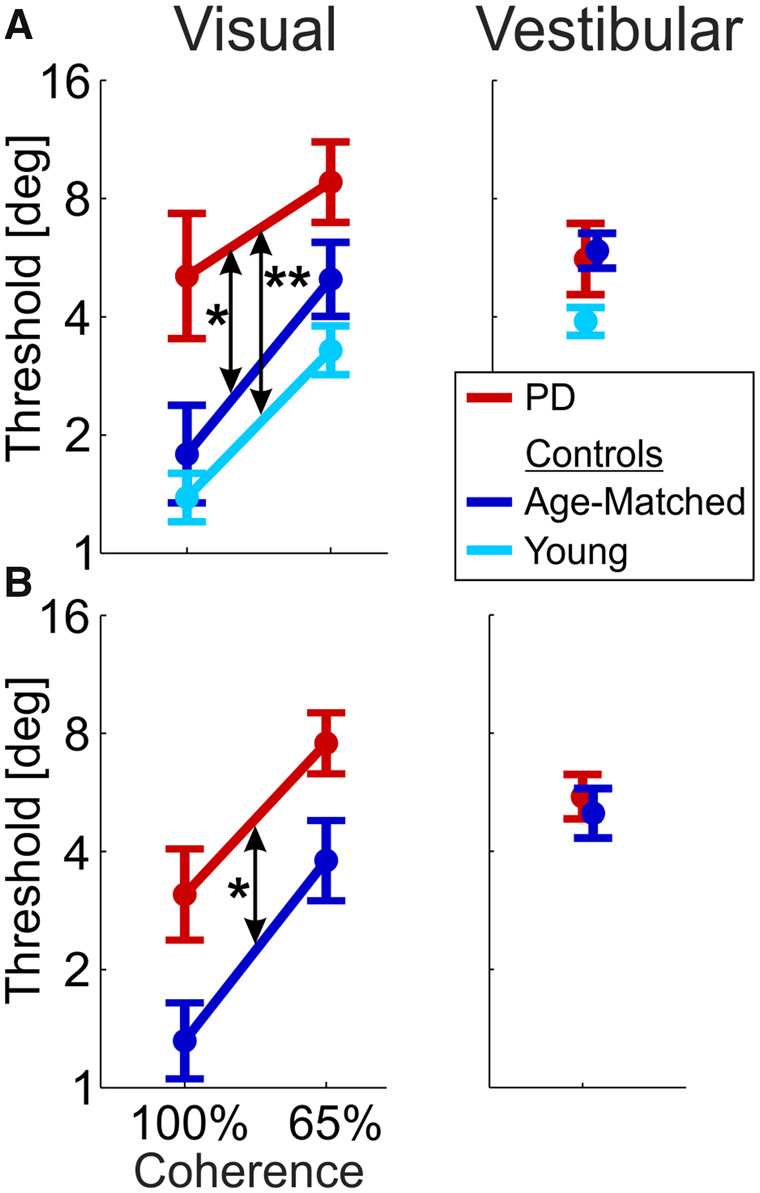
Figure 3.

Impaired visual self-motion perception in Parkinson’s disease.
Visual and vestibular thresholds (left and right columns, respectively) are presented for the Parkinson’s disease (PD, red), age-matched (dark blue) and young control (light blue) groups. (A) Data from Visit 1 (Parkinson’s disease on medication). (B) Data from Visit 2 (Parkinson’s disease off medication). Young controls were tested only once (Visit 1). Data points and error bars represent mean ± SEM. *P < 0.05; **P < 0.01.
