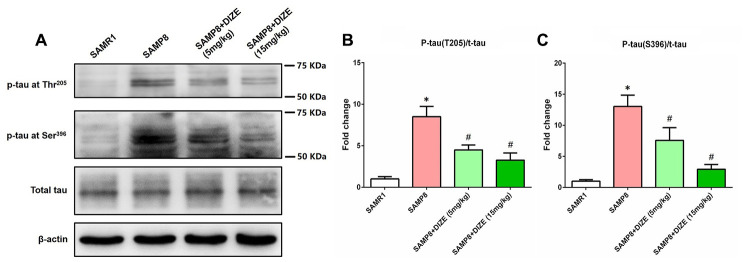
Figure 3.
DIZE ameliorated tau hyperphosphorylation in the brain of SAMP8 mice. (A) The levels of tau hyperphosphorylation at Thr205 and Ser396 sites as well as total tau in the brain were detected by western blot. β-actin was used as a loading control. (B) Quantitative analysis of tau hyperphosphorylation at Thr205/total tau ratio. (C) Quantitative analysis of tau hyperphosphorylation at Ser396/total tau ratio. Data from panel B and C were expressed as a fold change relative to the age-matched vehicle-treated SAMR1 control mice. Data were analyzed by one-way ANOVA followed by Tukey’s post hoc test. Columns represent mean ± SD (n=8 per group). *P<0.05 versus age-matched vehicle-treated SAMR1 control mice. #P<0.05 versus vehicle-treated SAMP8 mice.

