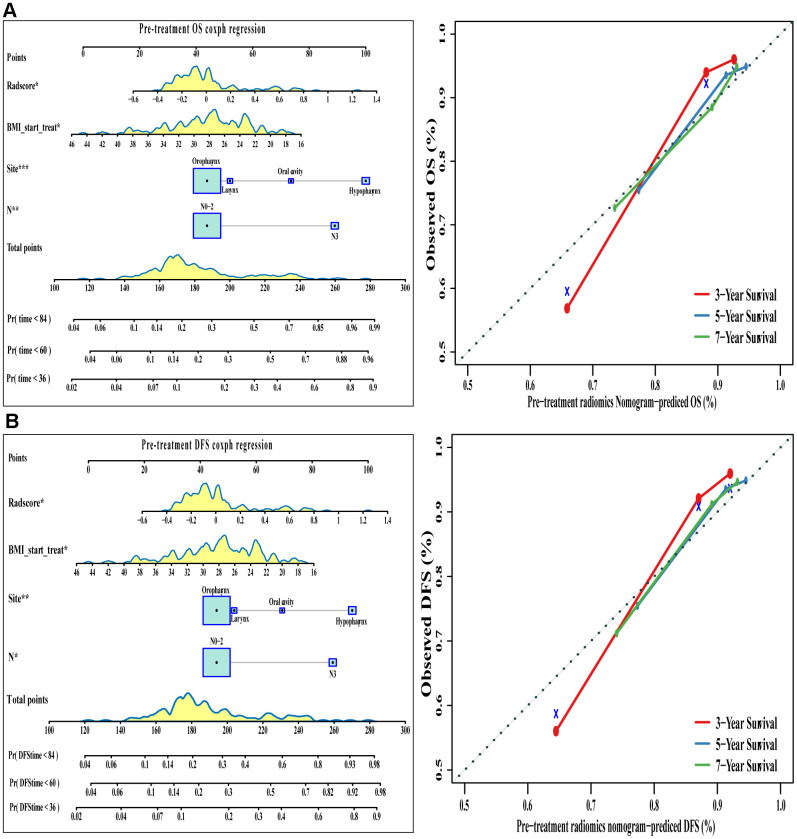
Figure 5.
The visualization of OS and DFS survival models based on pre-treatment Rad-score combined with clinicopathologic characteristics. The constructed nomograms and their calibration plots to estimate the OS (A) and DFS (B) in 3, 5, and 7 years. Abbreviations: OS: overall survival. DFS: disease free survival.

