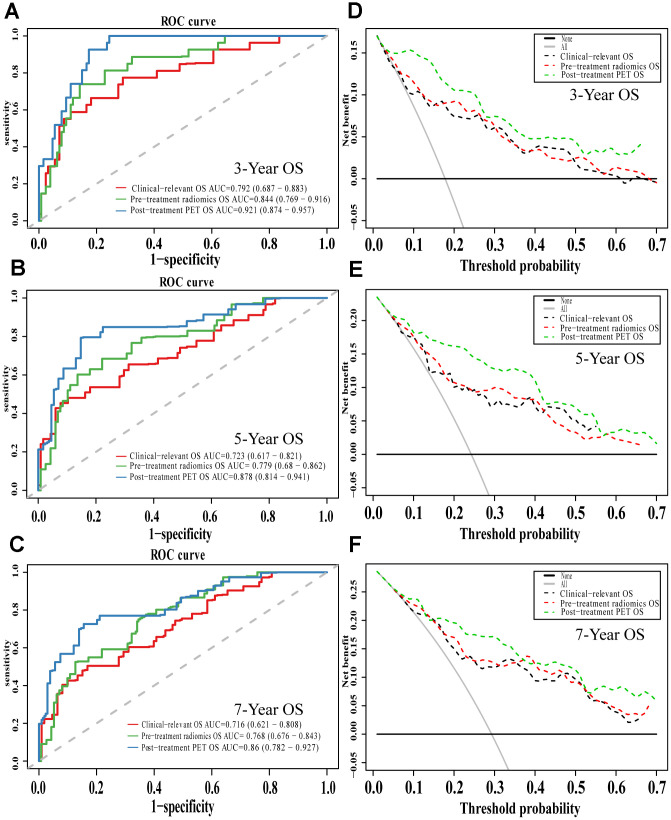
Figure 7.
The evaluation of built OS nomograms. The ROC curves and DCA curves of the comparison between clinical-relevant, pre-treatment and post-treatment survival OS models in 3, 5, and 7 years. The ROC curves of 3-year survival (A), 5-year survival (B) and 7-year survival (C). The DCA curves of 3-year survival (D), 5-year survival (E) and 7-year survival (F). Abbreviations: OS: overall survival. ROC: receiver operator curve. DCA: decision curve analysis.

