Figure 2.

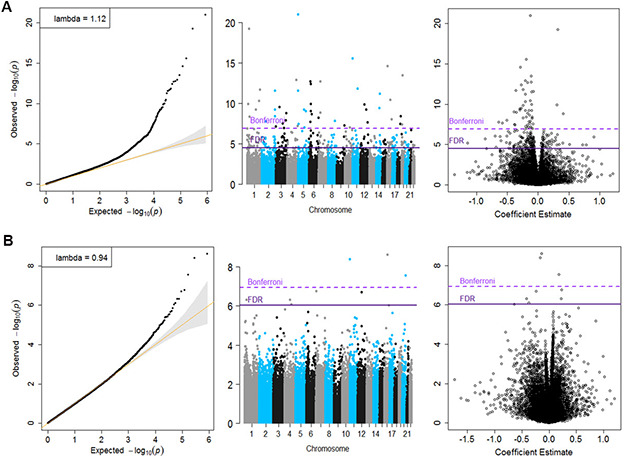
Quantile-Quantile plots, Manhattan and Volcano for the basic model (Panel A) and for the fully adjusted model (Panel B).

Quantile-Quantile plots, Manhattan and Volcano for the basic model (Panel A) and for the fully adjusted model (Panel B).