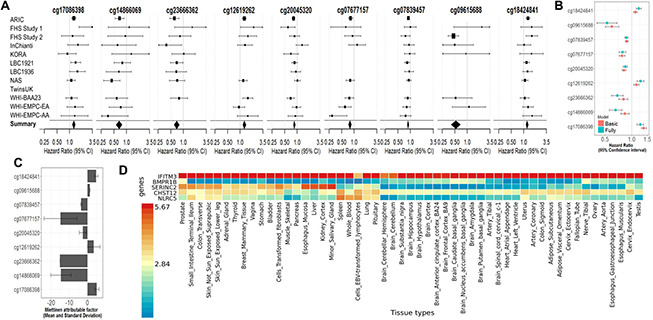
Figure 3.

(A) Forest Plots for the association of methylation levels of the FDR-significant fully-adjusted CpGs with risk of all-cause mortality in the CHARGE consortium. (B) Sensitivity analysis. Comparison of the hazard ratio of the basic-adjusted and the fully-adjusted fixed effect meta-analysis. (C) Attributable factor. Predicted Contribution (%) of increased methylation levels (above the mean) of each CpG to the all-cause mortality associations in NAS, WHI-EMPC (EA) and WHI-EMPC (AA). (D) Functional Mapping and Annotation results in order to examine tissue specificity of the genes mapped to the FDR-significant fully-adjusted CpGs.
