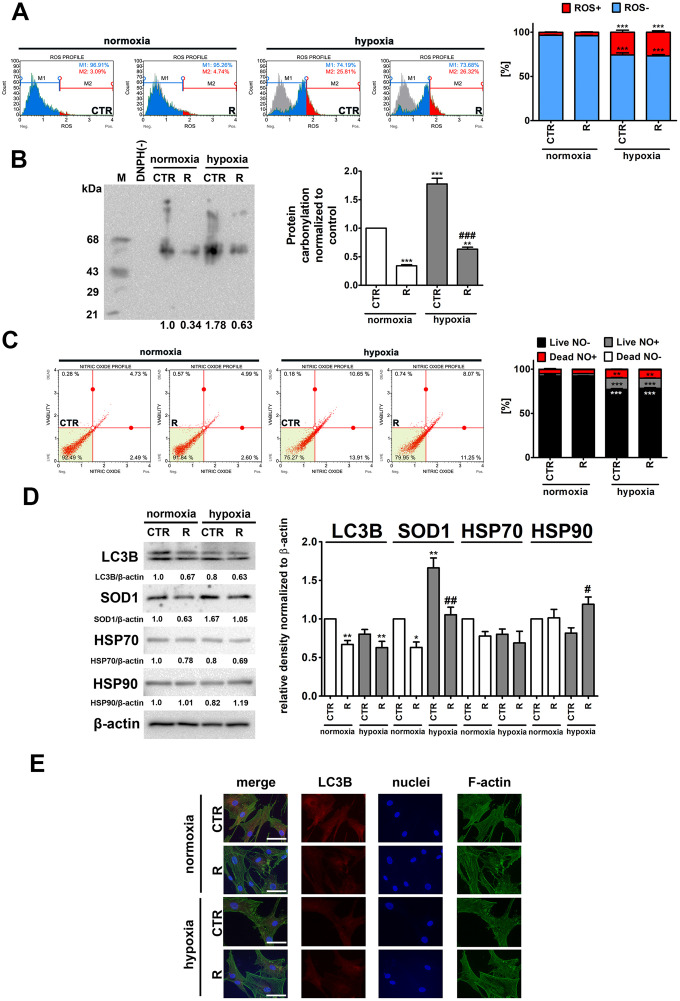
Figure 3.
Hypoxia-induced oxidative stress (A, B), nitrosative stress (C), adaptive oxidative stress, heat shock/chaperone and autophagy-based responses (D, E), and the effect of remifentanil preconditioning in HCM cells. (A) Superoxide levels were measured using Muse® Cell Analyzer and Muse® Oxidative Stress Kit. Representative histograms are presented. (B) Protein carbonylation was investigated using OxyBlot™ Protein Oxidation Detection Kit. A negative control without DNPH derivatization (lane DNPH(-)) and a positive control with a mixture of standard proteins with attached DNP residues (lane M) are also shown. The levels of oxidative protein damage were normalized and protein carbonylation during normoxic control conditions was considered as 1. (C) Nitric oxide levels were investigated using Muse® Cell Analyzer and Muse® Nitric Oxide Kit. Representative dot-plots are also shown. (D) Western blot analysis of the levels of LC3B, SOD1, HSP70 and HSP90. Data were normalized to β-actin. (E) Immunofluorescence analysis of cellular localization of LC3B (red). Representative microphotographs are shown, objective 10×, scale bars 15 μm. F-actin staining (green) and nucleus staining (blue) were also considered. Bars indicate SD, n = 3, ***p < 0.001, **p < 0.01, *p < 0.05 compared to normoxic control (CTR), ###p < 0.001, ##p < 0.01, #p < 0.05 compared to hypoxic control (CTR) (ANOVA and Dunnett's a posteriori test). CTR, control; R, remifentanil preconditioning.

