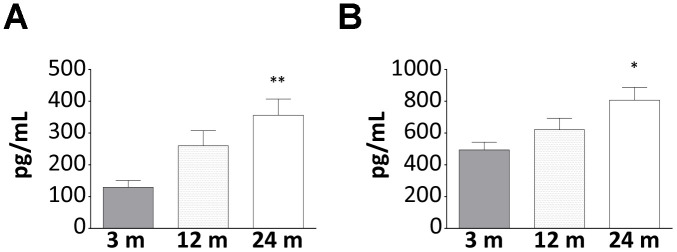
Figure 1.
Increase of AG and UnAG plasmatic levels during aging in WT mice. Plasmatic levels of AG (A) and UnAG (B) in 3-, 12-, and 24-month-old mice determined by EIA; 3-month-old mice: N = 5, 12-month-old mice N = 8, 24-month-old mice N = 6. Data in bar graph are presented as mean ± SEM. *p<0.05 and **p<0.01 vs. 3-month-old mice.

