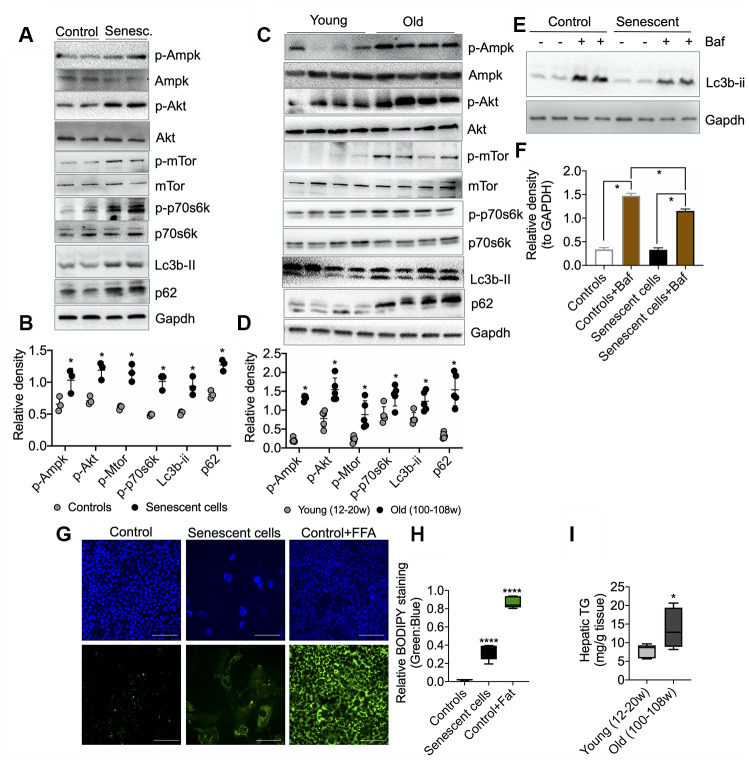
Figure 5.
Molecular analysis of energy-sensing pathways in senescent AML12 cells and liver tissues from young and old mice. (A) Western blot analysis of energy sensing and autophagic proteins including GAPDH in control and senescent AML12 cells. (B) Relative densitometric values of Western blots were calculated using ImageJ (NIH) software and normalized to GAPDH (n=3). (C) Western blot analysis of energy sensing and autophagic proteins including GAPDH in liver tissue from young and old mice. (D) Relative densitometric values of Western blots were calculated using ImageJ (NIH) software and normalized to GAPDH (n=5). (E) Western blot analysis of autophagy flux using lysosome inhibitor Bafilomycin A1 (Baf) in control and senescent AML12 cells under basal condition. (F) Relative densitometric values of Western blots were calculated using ImageJ (NIH) software and normalized to GAPDH (n=3). (G) Immunofluorescence analysis of neutral lipids accumulation (fat droplets) in control and senescent AML12 cells using BODIPY stain. Images were taken at 10x magnification. Control cells were treated overnight with 0.75 mM fatty acids Oleic Acid:Palmitic Acid (2:1) as a positive control. Scale bars as 100 mm. (H) Relative BODIPY fluorescence was calculated over Hoechst 33342 fluorescence using ImageJ software (NIH). (I) Hepatic triglyceride measurement was performed in the liver tissues from young and old mice. Statistical differences were calculated significant as *p<0.05 and ****p<0.0001.

