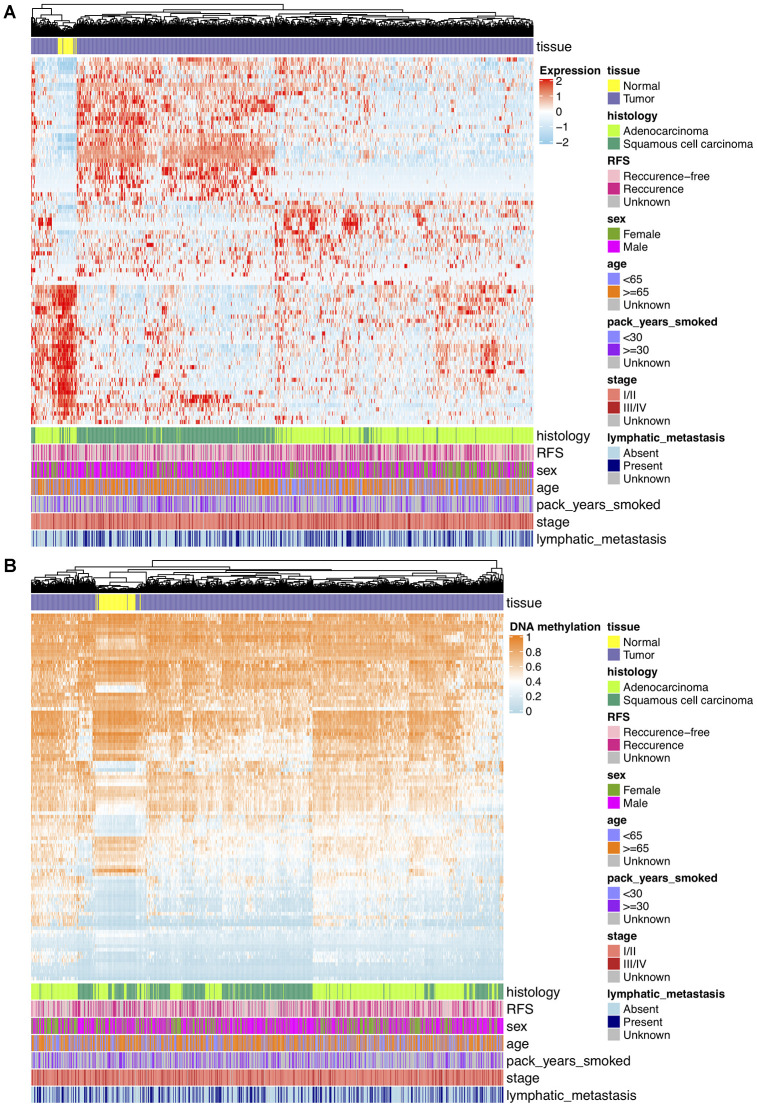
Figure 2.
(A) Hierarchical clustering of 87 unique DEGs that potentially regulated by changes in DNAm levels at 102 selected loci based on TCGA NSCLC gene expression data (821 tumor and 28 normal samples). Clinical and demographic features, including age, sex, pack-years smoked, histology, stage, lymphatic metastasis and clinical outcome (RFS, recurrence-free survival status). High expression, red; low expression, skyblue. (B) Hierarchical clustering of 102 significantly DMPs between NSCLC (n=827) and normal (n=74) samples. Hopomethylated CpGs, skyblue; hypermethylated CpGs, orange.

