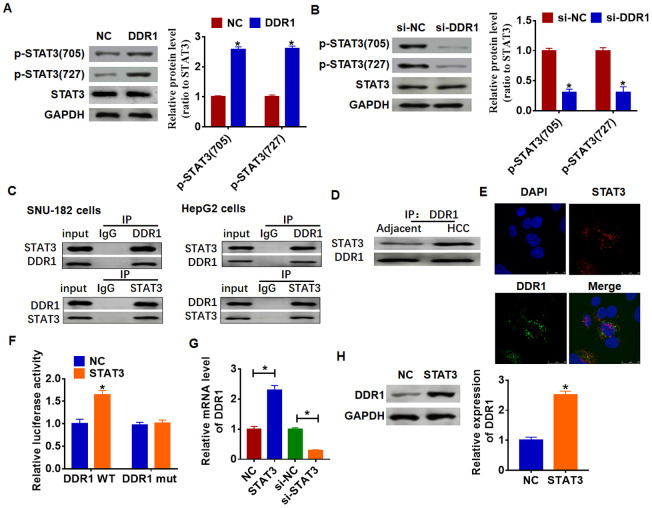
Figure 4.
DDR1 interacts with STATA and promotes STAT3 phosphorylation. (A) DDR1 plasmid or NC was transfected into Hep3B cells. Western blot was performed to test the expression of STAT3 and phosphorylated STAT3 (n = 6, *p<0.05). (B) The siRNA of DDR1 or NC was transfected into SNU-182 cells. The level of STAT3 and phosphorylated STAT3 was calculated by western blot (n = 6, *p<0.05). (C) CO-IP was used to determine the relationship between DDR1 and STAT3. DDR1 was pulled down by STAT3, and STAT3 was pulled down by DDR1 (n = 4). (D) CO-IP analysis for DDR1 and STAT3 in adjacent normal tissues and HCC tissues. (E) Immunofluorescence analysis used to detect the location of DDR1 and STAT3. Nucleus was blue stained by DAPI, red represents STAT3 and green represents DDR1. (F) Luciferase assay used to determine the binding between STAT3 and DDR1 promoter (n = 6, *p<0.05). STAT3 plasmid or siRNA of STAT3 or NC was transfected into Hep3B cells. The mRNA expression or protein level of DDR1 was tested by qRT-PCR (G) and western blot (H), respectively (n = 6, *p<0.05).

