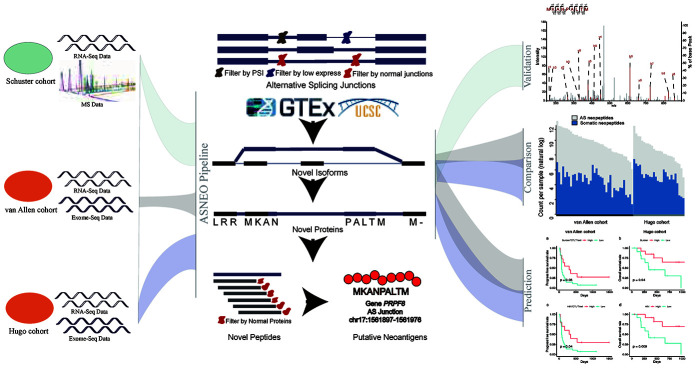
Figure 1.
A comprehensive workflow to analyze AS neopeptides by ASNEO. The left part represents the data of three cohort used in the analyses. The middle part represents the computational pipeline of ASNEO for identification of AS neopeptides. The right part represents three main analyses performed in this work, containing evaluation of ASNEO by mass spectrometry (MS) analysis (top), immune score comparison of AS neopeptides with somatic neopeptides (middle), and predictability evaluation of AS neopeptides by survival analysis (bottom).

