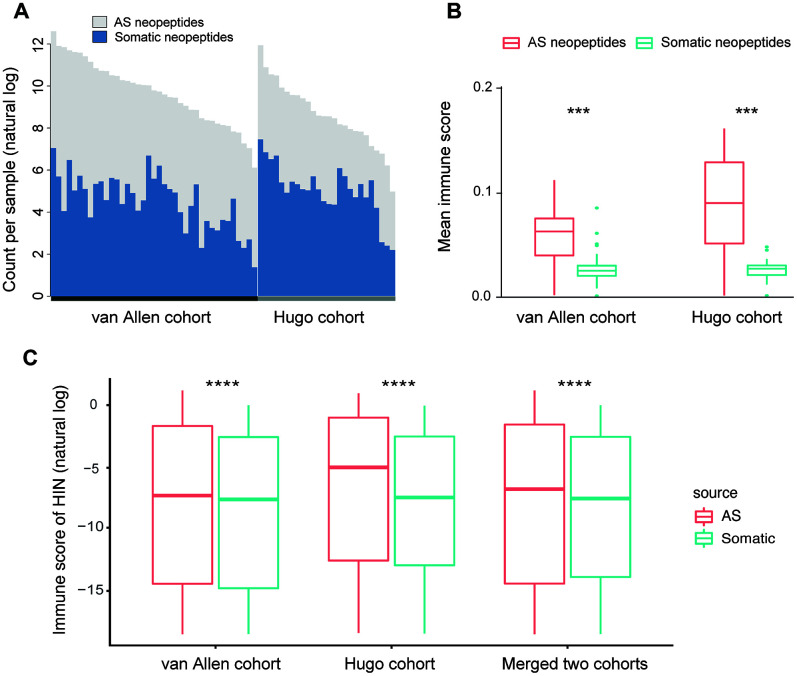
Figure 4.
Comparison of AS neopeptides with somatic neopeptides. (A) The number of somatic neopeptides and AS neopeptides. Within each cohort, patients were sorted by total neoantigen burden. Neopeptide counts (y-axis values) were represented in natural log format. (B) In each cohort, AS neopeptides showed a higher mean immune score profile than that of somatic neopeptides (van Allen cohort: Wilcoxon test P=1.5e-08; Hugo cohort: Wilcoxon test P=9.1e-06). (C) Using HIN, AS neopeptides showed a significant higher immune score than that of somatic neopeptides in both van Allen cohort and Hugo cohort as well as in merged two cohorts (Wilcoxon test, P<2.2e-16 for all). The immune scores of neopeptides (y-axis values) were represented in natural log format. HIN: high immune neopeptides.

