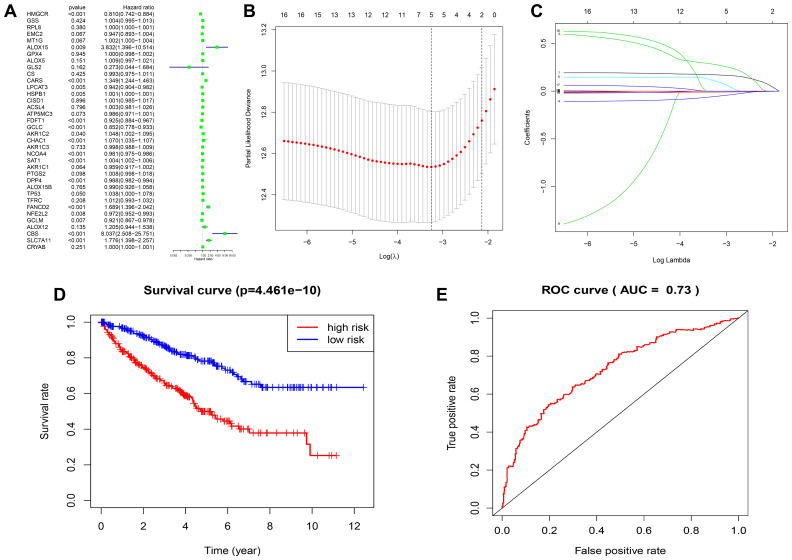
Figure 5.
Construction of FRG-based survival model for prognostic prediction in ccRCC. (A) Univariate Cox regression analysis results show the hazard ratios (HR) with 95% confidence intervals (CI) and p values for the 36 FRGs. (B, C) Risk score model construction for FRGs using Lasso regression analysis. (B) Partial likelihood deviance was plotted against log (lambda). The vertical dotted lines indicate the lambda value with minimum error. The largest lambda value is where the deviation is within one standard error (SE) of the minimum. (C) The Lasso coefficient profiles of FRGs in ccRCC. (D) Kaplan–Meier survival curves show overall survival of high- and low-risk ccRCC patients that are grouped according to the risk scores calculated by the new survival model based on the expression of 5 FRGs. (E) ROC curve analysis shows the prognostic prediction efficiency of the new survival model. As shown, the AUC value for the new survival model is 0.73.

