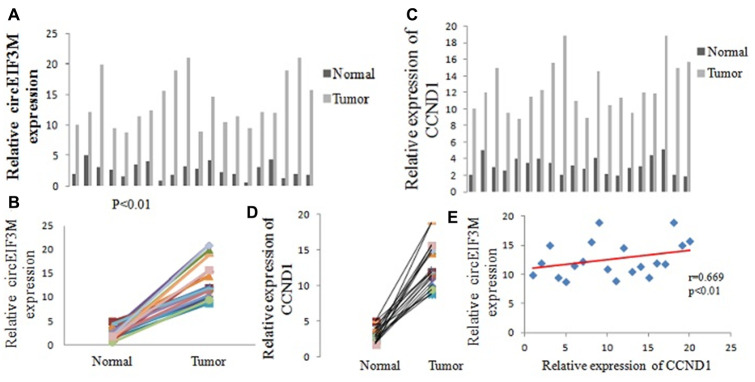
Figure 3.
CircEIF3M and CCND1 are upregulated in TNBC. (A and B) Relative expression of circEIF3M in TNBC tissues (Tumor) and adjacent non-tumor tissues (Normal) was detected by qRT-PCR (n = 20). (C and D) Relative expression of CCND1 in TNBC tissues (Tumor) and adjacent non-tumor tissues (Normal) was detected by qRT-PCR (n =20). (E) Pearson correlation analysis of circEIF3M and CCND1 expression in 20 TNBC tissues. Data were showed as mean ± SD, P < 0.01.

