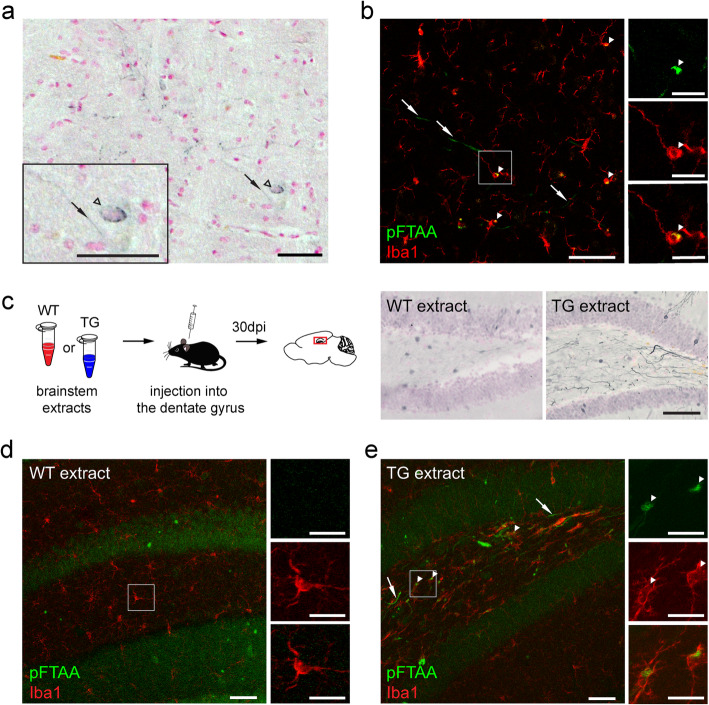
Fig. 4.
pFTAA-positive microglia in presymptomatic αS TG mice and seeded αS induction model. (a, b) Representative brainstem sections of a 15-month-old presymptomatic Thy1-h[A30P]αS mouse, presumed 4–6 weeks before the first symptoms occur. (a) Immunostaining of p-αS-positive aggregates (black). Perikaryal (arrowhead outlines) and neuritic (arrows) inclusions are highlighted. Section was counterstained using nuclear fast red. Scale bars, 50 μm and 20 μm (insert). (b) Fluorescence double staining of Iba1-positive microglia (red) and pFTAA-positive inclusions (green), showing neuritic pFTAA-positive inclusions (arrows) and pFTAA-positive aggregates in Iba1-positive cells (arrowheads). Example of a pFTAA-positive microglia is shown in high magnification (inserts). Scale bars, 50 μm and 20 μm (inserts). (c) Schematic illustration of the intracerebral injection paradigm (left) and sagittal sections of dentate gyrus (DG, site of injection) stained with p-αS antibody (blue) from Thy1-h[A30P]αS mice that have been injected 30 days prior with either brainstem extract from end-stage TG mice (TG extract) or brain extract from WT mice (WT extract). In TG extract-injected mice, abundant p-αS-positive aggregates were detected. In contrast, WT extract did not induce any inclusion. Sections were counterstained using nuclear fast red. Scale bar, 100 μm. (d, e) Representative sagittal sections from either WT extract- (d) or TG extract-injected (e) Thy1-h[A30P]αS mice stained with pFTAA (green) and Iba1 (red). (d) No pFTAA-positive inclusions can be found in microglia of WT extract-injected mice. Scale bars, 50 μm and 20 μm (enlarged images). (e) In contrast, pFTAA-positive inclusions are found in Iba1-positive microglia in DG from Thy1-h[A30P]αS mice. Examples of neuritic pFTAA-positive inclusions (arrows) and pFTAA-positive deposits in microglia (arrowheads) are highlighted. Scale bars, 50 μm and 20 μm (enlarged images)

