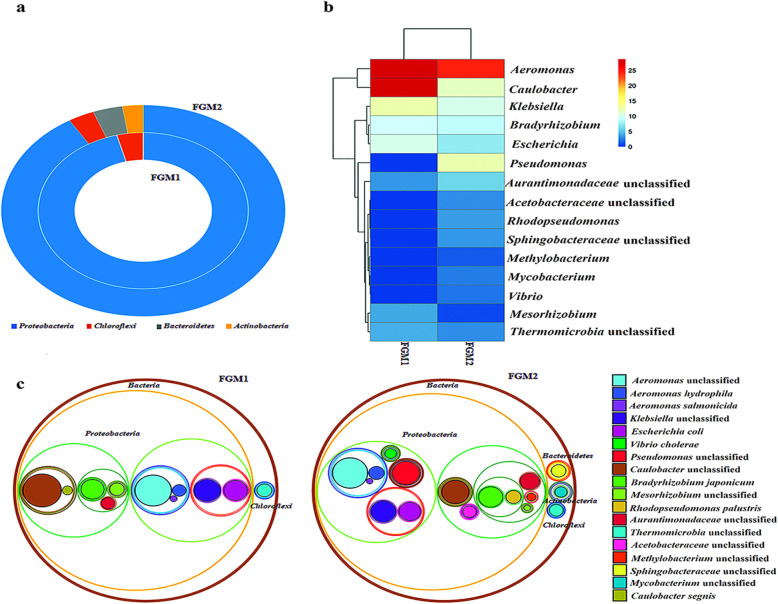
Fig. 1.
Composition of gut microbiome in endangered Tor putitora. a Figure showing relative abundance of different phyla in fish gut metagenome. b The hierarchical clustering in heatmap shows the abundance of different genera enriched in the gut microbial community. 7.34 and 15.27% of the reads could not be assigned to any genus in FGM1 and FGM2, respectively. c Species-level classification of fish gut microbiome. The diameter of the circle represents the proportion of reads assigned to the particular species. The arrangement of circles represents the hierarchy from kingdom to species level

