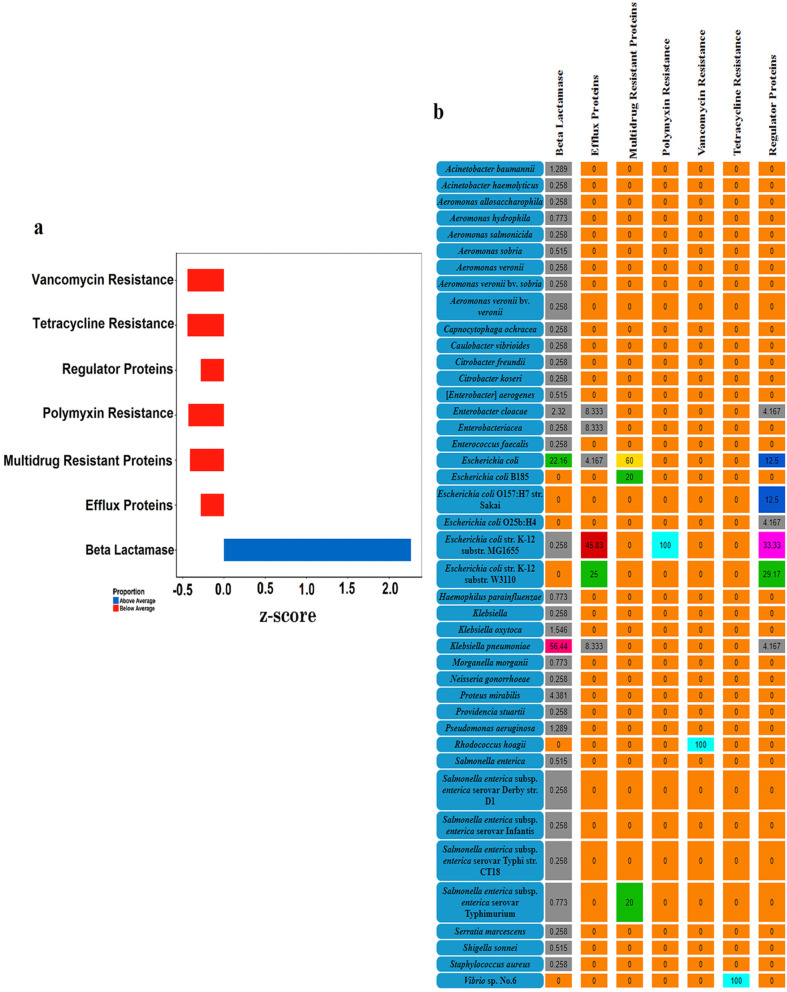
Fig. 5.
Antibiotic resistance pattern of gut microbiome in endangered Tor putitora. a Distribution of different antibiotic resistance genes in the fish gut microbiome. The data was normalized and the calculation of z-score showed the highly abundant genes for different variants of extended spectrum β-lactamases. b The relative distribution of antibiotic resistance genes in different bacteria present in the gut of Tor putitora. The colour code indicates the distribution of ARGs ranging from none to 100%. All the zero values are given in orange. The percentages varying from 0 to 10% are highlighted grey. The 10–20% interval is shaded blue while 20–30% range is represented by green colour. The magenta, dark-red, dark-pink and yellow colour code represent 30–40%, 40–50%, 50–60% and 60–70% distribution, respectively whereas turquoise highlights 100% abundance

