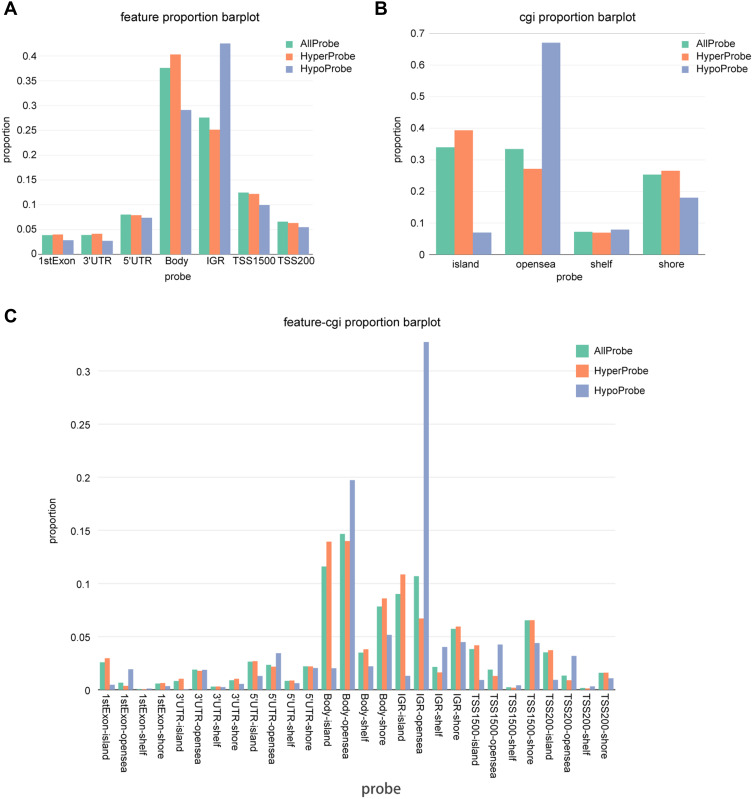
Figure 2.
Distribution of top 1000 differentially methylated imprinted CpG sites. (A) Distribution of top 1000 differentially methylated imprinted CpG sites according to CpG islands (island, open sea, shelf, and shore). (B) Distribution of top 1000 differentially methylated imprinted CpG sites according to the position relative to genes (1st exon, 3′ UTRs or 5′ UTRs, body, IGR, TSS1500, and TSS200). (C) Combined genetic and epigenetic annotation information revealed the distribution of the top 1000 differentially methylated imprinted CpG sites.

