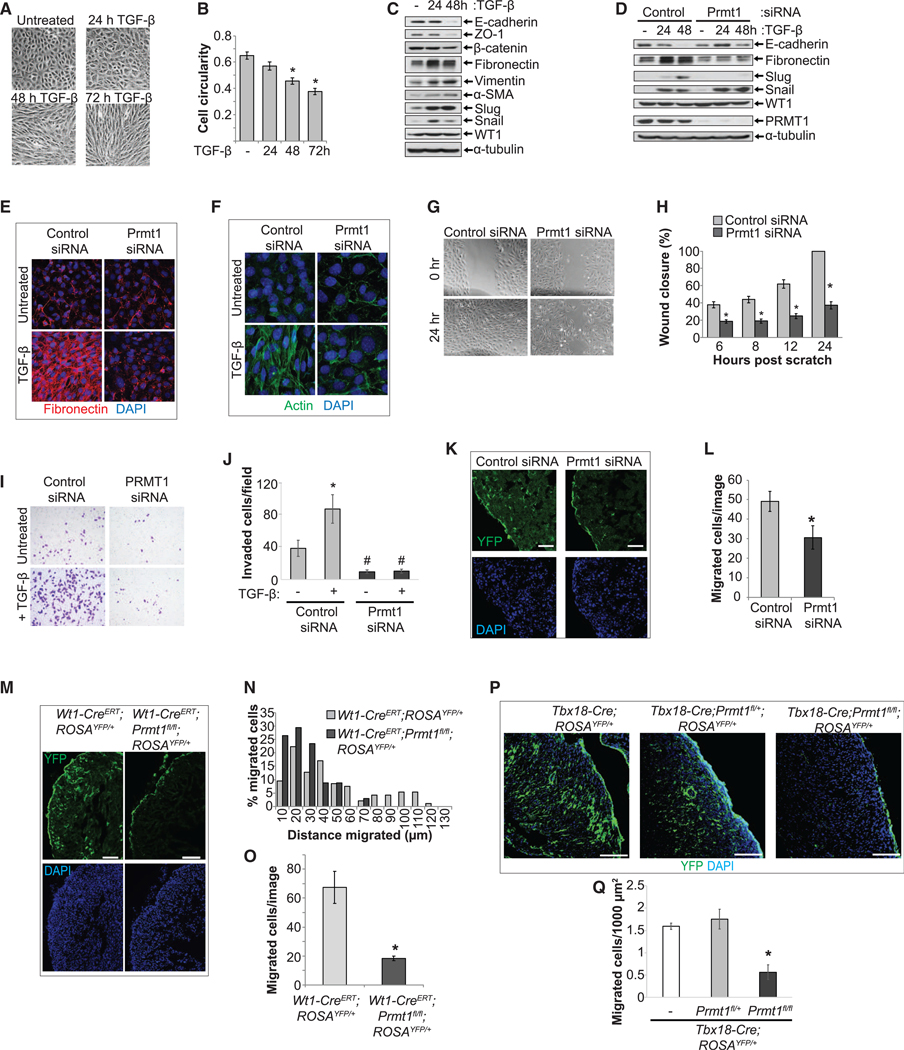
Figure 1. PRMT1 Is Required for Epicardial Migration and Invasion.

(A and B) TGF-β induced characteristic EMT changes in epicardial MEC1 cells. Phase contrast images shown in (A). Cell circularity is quantified in (B).
(C) Epicardial cells that underwent EMT exhibited decreased epithelial markers and increased mesenchymal markers. MEC1 cells lysates were analyzed by SDSPAGE and blotted for the indicated proteins.
(D) Depleting Prmt1 prevented TGF-β-induced changes in EMT marker proteins E-cadherin, fibronectin, and Slug. Snail and WT1 were unaffected.
(E) Depleting Prmt1 prevented fibronectin matrix formation. Confocal images for fibronectin immunostaining.
(F) Depleting Prmt1 blocked actin stress fiber formation. Confocal images of actin fibers visualized by phalloidin.
(G and H) Prmt1 depletion reduced epicardial cell migration. Phase contrast images of MEC1 cells at 0 or 24 h after scratching are shown in (G). The percentage of wound closure is quantified in (H). *p < 0.05 versus control siRNA.
(I and J) Prmt1 depletion prevented epicardial cell invasion. MEC1 cells that invaded are imaged in (I) and quantified in (J). *p < 0.05 versus untreated, #p < 0.05 versus control siRNA.
(K and L) Prmt1 knockdown significantly decreased the number of YFP-labeled epicardial-derived cells that migrated into myocardium. Wt1-CreERT;ROSAYFP/+ embryonic hearts dissected at E12.5 were incubated with control or Prmt1 siRNA and then cultured in the presence of TGF-β. YFP was visualized by immunostaining and confocal imaging (K). The left ventricular wall (LV) is shown. Scale bar, 25 μm. Migrated cells per image are quantified in (L). *p < 0.05 versus control siRNA.
(M–O) Epicardial-specific deletion of Prmt1 using Wt1-CreERT led to inhibition of epicardial invasion. YFP is visualized in E15.5 hearts in (M). The LV is shown. Scale bar, 25 μm. The histogram in (N) shows the percentage of migrated cells at increasing distances from the epicardium. Data were pooled from 3 hearts per genotype. Migrated cells per image are quantified in (O). *p < 0.05 versus Wt1-CreERT;ROSAYFP/+.
(P and Q) Tbx18-Cre-driven deletion of Prmt1 in epicardial cells suppressed invasion. YFP is visualized in P0 hearts in (P). The LV is shown. Scale bar, 100 μm. Migrated cells per 1,000 mm2 are quantified in (Q). *p < 0.05 versus Tbx18-Cre;ROSAYFP/+.
