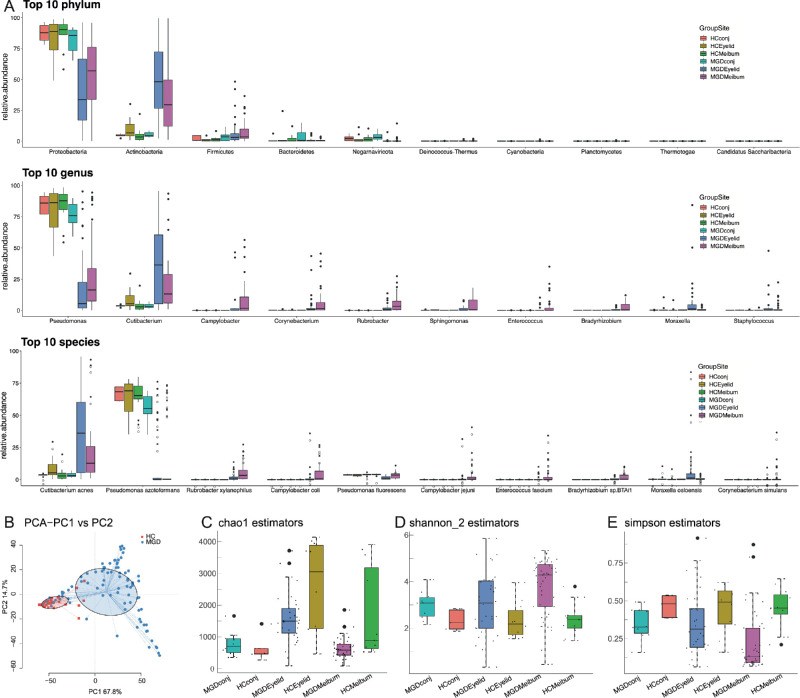
Figure 2.
Overall comparison of taxonomic classification in the microbiome of all samples. (A) Microbial diversity in meibum, eyelid skin and conjunctiva. (B) Principle coordinate analysis (PCoA) plot of microbial communities at the genus level (centrifuge). (C-E) Alpha diversity measured by KO abundance for MGD patients and HC individuals.

