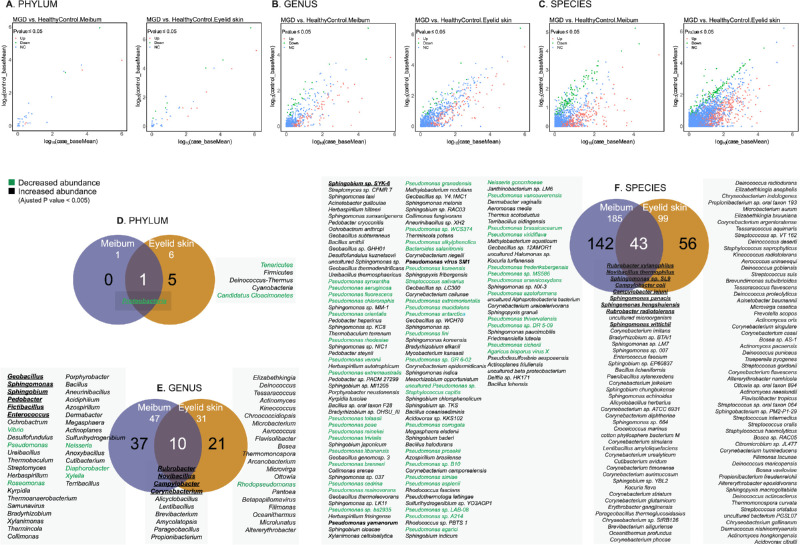
Figure 3.
Comparison of significant changes at the different taxonomic levels in meibum and eyelid microbiomes of patients with MGD. Dot plots show the mean abundance of each taxa in different classifications (A: phylum, B: genus, C: species) in patients with MGD (x-axis) and healthy control (HC) individuals (y-axis). The colors of dots indicate if the taxon has a significantly higher (red)/lower (green) abundance in patients with MGD (adjusted P value < 0.05, Benjamini-Hochberg), or their abundance is at similar levels in MGD and HC groups (blue). Venn plots show the common and specific taxa (D: phylum, E: genus, F: species) with most significant abundance changes (adjusted P value < 0.005, Benjamini-Hochberg) in microbiomes from the meibum and eyelid skin of MGD patients. The taxa shown in green have a significantly lower abundance in MGD meibum. Bold italics denote top 10 taxa with differential abundance in the MGD meibum microbiome. The taxa ranking is based on their significance level.

