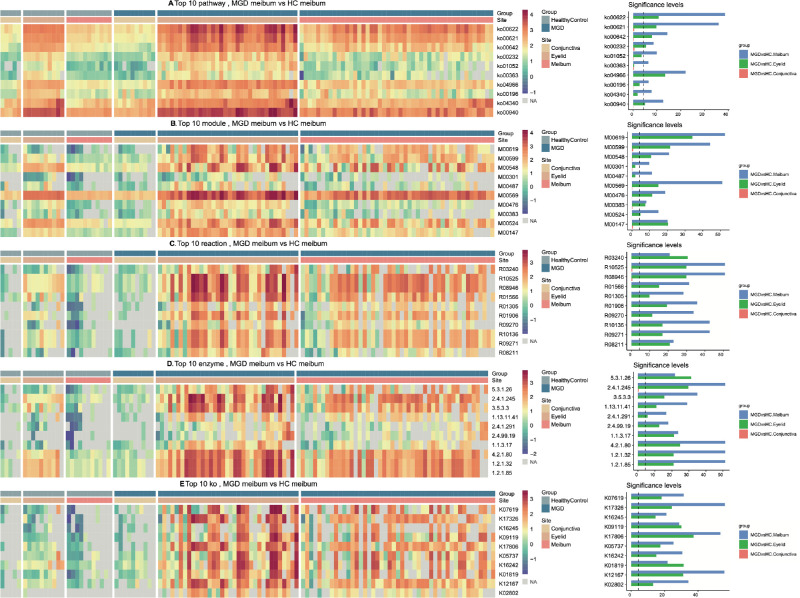
Figure 4.
Over-representation of functions in microbiomes from patients with MGD and HCs. Annotations according to KEGG database at different layers: (A) Pathway; (B) Module; (C) Reaction; (D) Enzyme; (E) KEGG Orthology, KO. Full annotations for each entry are listed in Supplementary Table S11. The rank of the top 10 entries is listed in a descending order according to fold change of abundance in MGD meibum. Right panel: x-axis, -log2 (adjusted P value), dashed vertical line: adjusted P value = 0.05.

