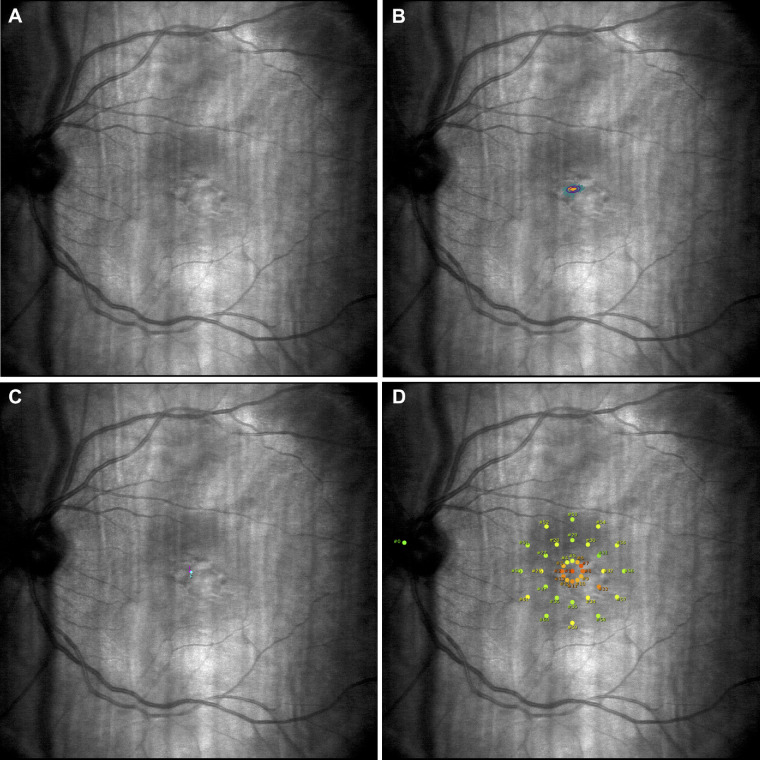
Figure 2.
Left retina (A) and visual fixation area (B) of trained participant SC during microperimetry assessment. The cyan dots in B indicate fixation locations throughout the test, with the smaller purple ellipse signifying retinal stability for 63% of the test. (C) The participant's PRL; the pink dot illustrates the average retinal fixation locations during the first 10 seconds of the test, and the cyan dot illustrates the average PRL based on average fixations throughout the test. (D) The participant's retinal sensitivity map and the center of the optic nerve (the green dot on the left). The orange dots illustrate the least sensitive retinal areas, and the green dots illustrate the most sensitive regions.

