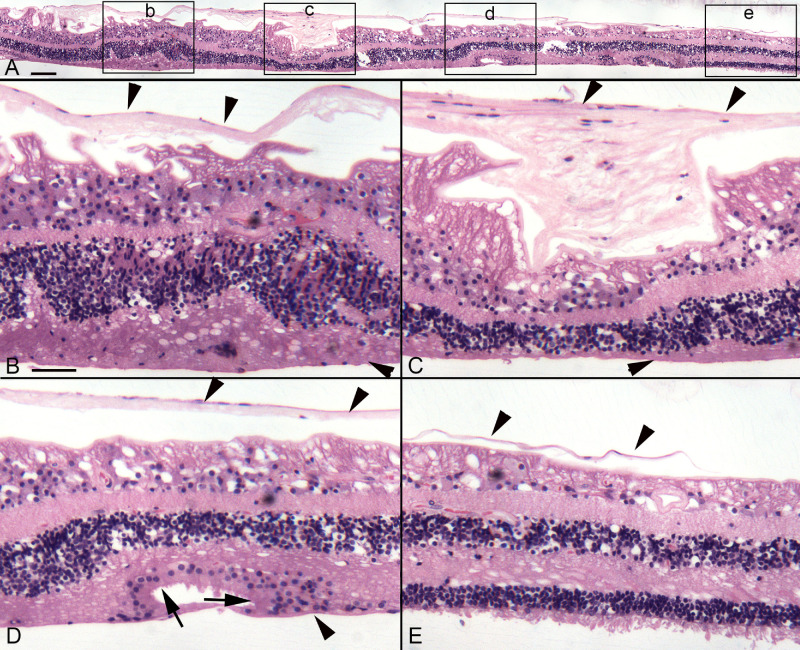
Figure 10.
JB-4 sections of donor 3’s retina. The other half of the retina from donor 3 was embedded in JB-4, 2 µm sections cut, and stained with hematoxylin and eosin. (A) A panoramic image shows the retina from the atrophic area (left) to a relatively normal but thin area (right). Boxes indicate the areas shown at higher magnification in B to E. (B) Within the atrophic area, a large preretinal membrane is observed (down-facing arrowheads) and retinal lamination is affected as evident by stress fibers within the ganglion cell layer. The ONL is thickened in this area but cells are displaced as are those in the INL. (C) The preretinal glial membrane is thicker in this area, resulting in severe traction on the retina and loss of retinal lamination. The ONL is thinner and the INL is displaced. A membrane is also evident in the subretinal space (arrowhead). (D) Although stress marks are still evident in the ganglion cell layer, the retinal lamination is better than in other areas. An apparent ORT is evident in which the ELM is intact (arrows). (E) At the atrophic border, the ONL is thin but outer segments are present. Numerous cells are displaced from the INL, migrating through the outer plexiform layer. The preretinal membrane (up-facing arrowheads) is present but appears to be ending where the atrophy ends. Scale bars indicate: A: 100 µm, B–E: 50 µm.

