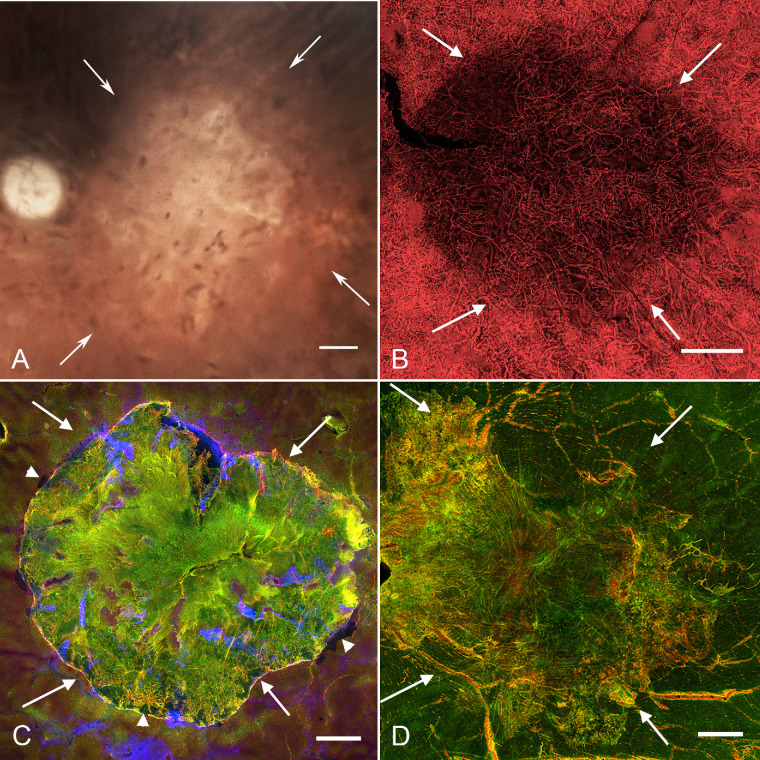
Figure 6.
Histopathologic presentation of donor 3 (FFB 878). (A) Gross image reveals the area of RPE atrophy (defined by arrows), where choroidal vessels are visible. (B) UEA lectin staining demonstrates CC attenuation in the atrophic region (arrows). (C) Müller cell processes labeled with vimentin (green) and GFAP (red) occupy the area of atrophy (arrows) when retinas are imaged with the ELM en face. Arrowheads indicate migrating RPE at the border of the glial membrane. (D) When the retina was imaged with the ILM en face, a large, dense glial membrane was observed (arrows) covering an area very similar but slightly larger than the atrophic area. Scale bars indicate 1 mm.

