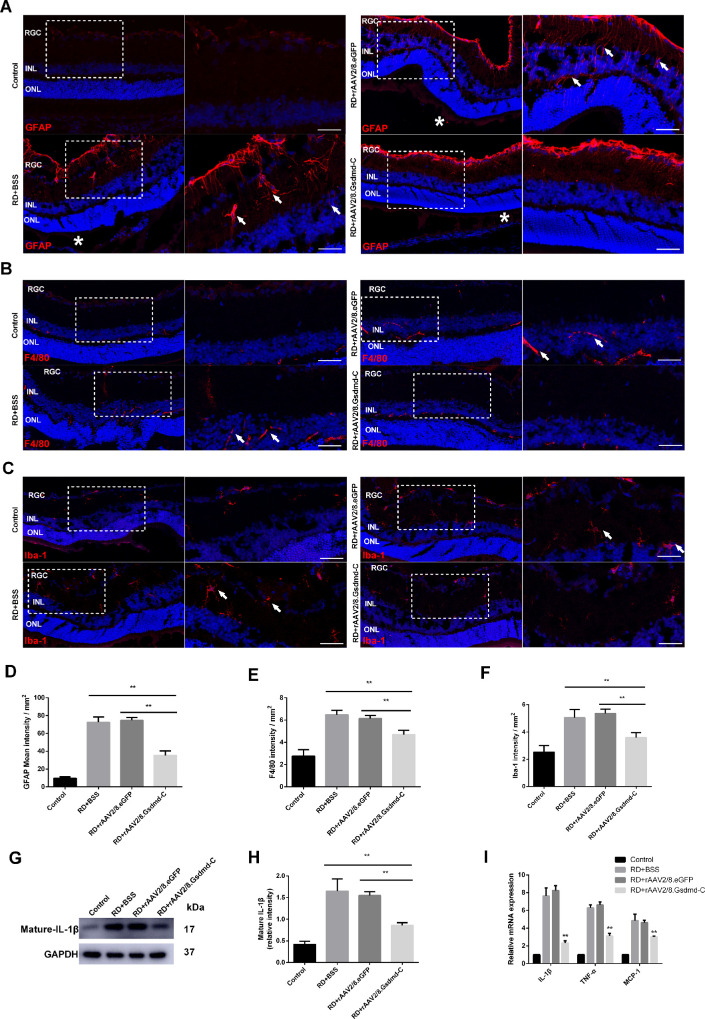
Figure 5.
Involvement of rAAV2/8–GSDMD-C in the inflammatory response after RD. (A) Representative GFAP staining (red) in rat retinal sections. The eyes were treated with BSS, rAAV2/8–GSDMD-C, or rAAV2/8–eGFP and assessed 7 days after RD surgery (n = 6). DAPI was used to visualize the cell nuclei. White arrows indicate longitudinal fiber-like GFAP signals in the inner plexiform layer (IPL); white asterisks indicate separation points between detached and attached retina. Scale bars: 25 µm. (B) Representative F4/80 staining (red) in rat retinal sections. The eyes were treated with BSS, rAAV2/8–GSDMD-C, or rAAV2/8–eGFP and assessed 1 day after RD surgery (n = 6). DAPI was used to visualize the cell nuclei. White arrows show the intensified F4/80 signal in the outer plexiform layer (OPL) and INL. (C) Representative Iba-1 staining (red) in rat retinal sections. The eyes were treated with vehicle BSS, rAAV2/8–GSDMD-C, or rAAV2/8–eGFP and assessed 1 day after RD surgery (n = 6). DAPI was used to visualize the cell nuclei. White arrows indicate the amoeboid-like Iba-1 signal in the IPL and retinal ganglion cells (RGCs). (D–F) Quantification of the immunofluorescence intensity in all four groups (n = 6). Data are expressed as the mean ± SD. Statistical analysis was performed via ANOVA with Bonferroni correction for the three independent experiments. (G) Western blotting analysis of mature IL-1β in retinal lysates 1 day after RD in all four groups (n = 6). (H) Densitometry analysis of the western blotting data indicated that mature IL-1β decreased in the rAAV2/8–GSDMD-C-treated group 1 day after RD (n = 6). Data are expressed as the mean ± SD. Statistical analysis was performed via ANOVA with Bonferroni correction for the three independent experiments. (I) mRNA levels of IL-1β, TNF-α, and MCP-1 were detected by qRT-PCR, and it was found that rAAV2/8–GSDMD-C treatment significantly reduced inflammatory factor transcription levels 1 day after RD (n = 6). **P < 0.01.

