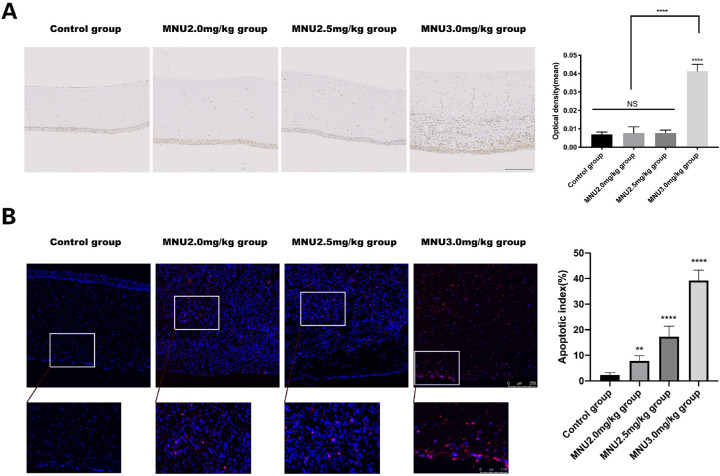
Figure 12.
(A) Immunohistochemical staining for 8-OHdG was significantly stronger in the 3.0-mg/kg group than in the control group. Staining for 8-OHdG was similar among the 2.0-mg group, the 2.5-mg/kg group, and the control group. Scale bar = 500 µm. (B) TUNEL staining revealed a limited number of apoptotic cells in corneal sections from animals in the control group. MNU-treated rabbits had numerous apoptotic cells throughout all corneal layers )red: apoptosis; blue: DAPI(. The AI of the 3.0-mg/kg group was significantly higher than that of the 2.0- and 2.5-mg/kg groups (1-way ANOVA followed by Dunnett's multiple-comparisons test, ****P < 0.0001, ** P < 0.01 in comparison with the control group; n = 3; all values represent mean ± SEM). Scale bar = 250 and 100 µm.

