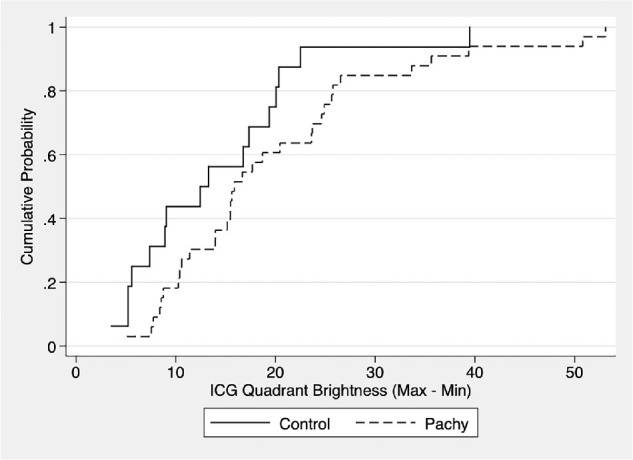
Figure 3.

Graph of the cumulative distribution function (CDF) of max-min ICGA quadrant brightness. Max-min value of ICGA quadrant brightness is a nonuniformity measure and was calculated by subtracting the brightness level of the quadrant with the least brightness from the quadrant with the greatest brightness in a given eye. Note that pachychoroid eyes (Pachy) uniformly had greater max-min values than control eyes across the board.
