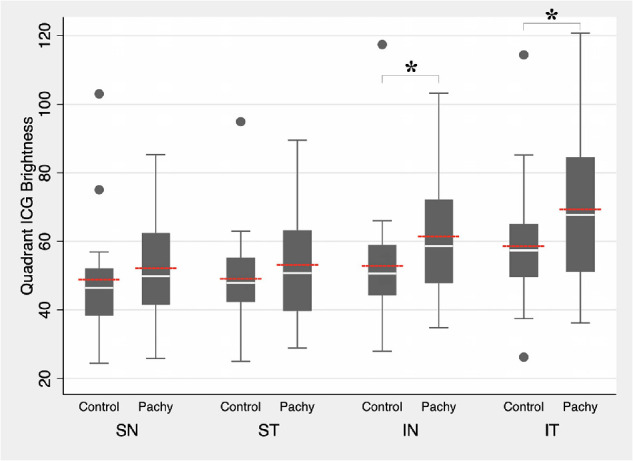
Figure 4.

Intraquadrant comparison of quadrant brightness level between control and pachychoroid eyes. White lines indicate median value. Red lines indicate mean value. Boxplots indicate minimum, 25th percentile, 75th percentile, and maximum values. ICG, indocyanine green; IN, inferonasal quadrant; IT, inferotemporal quadrant; Pachy, pachychoroid eyes; SN, superonasal quadrant; ST, superotemporal quadrant. *Significant at P < 0.05 comparing mean values.
